News topics
AI summaries
Note that all the summary texts on this page are currently generated automatically using a Large Language Model (Google’s Gemini), based on the results tables and other information from the data. Therefore, please do not cite the verbal summary, but refer to the figures and tables for accurate information.
Overview
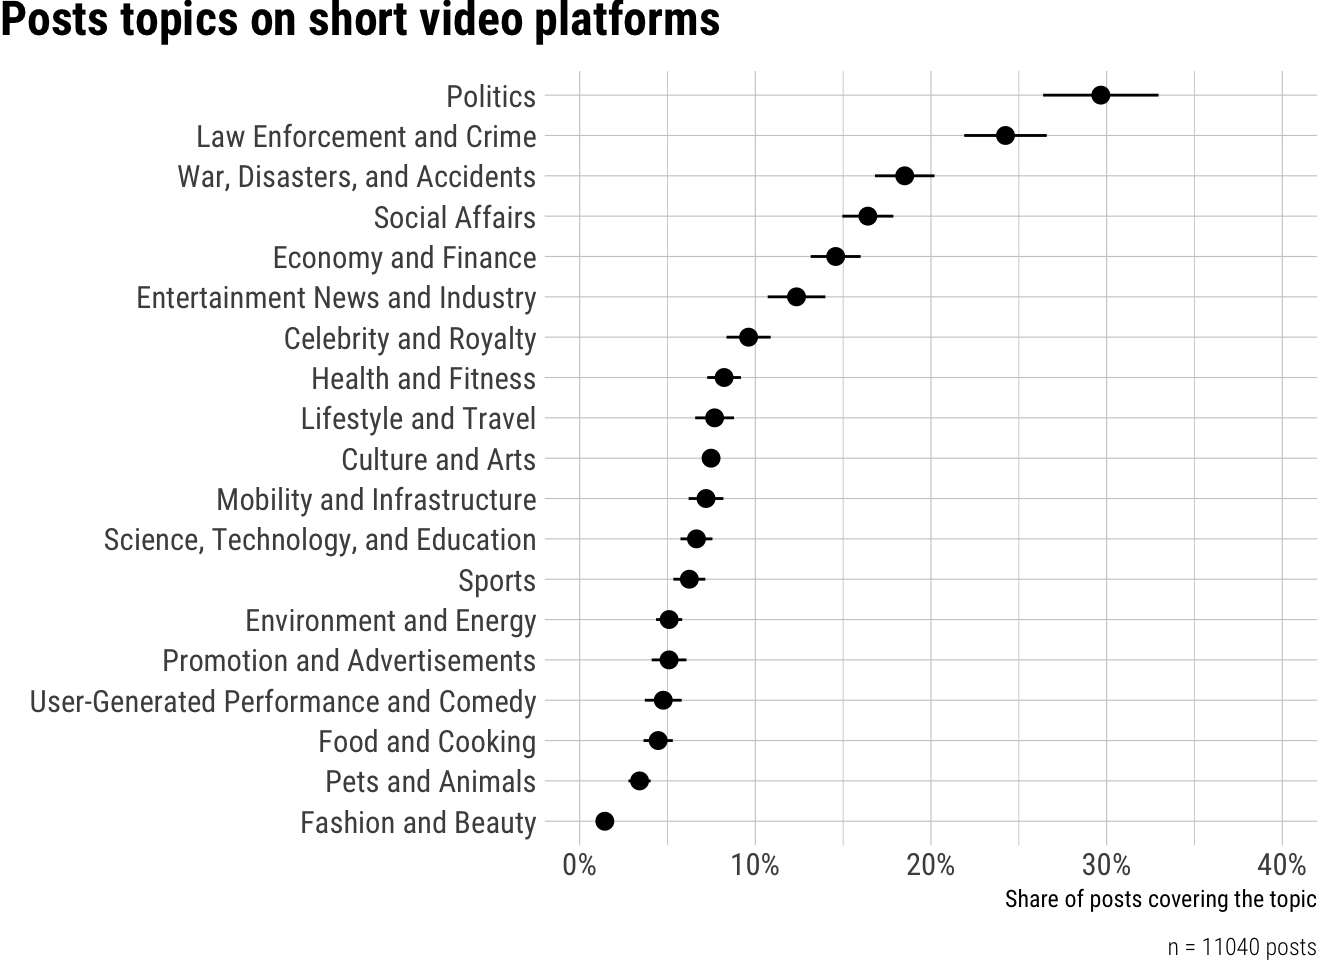
We analyzed the topics of the posts by using zero-shot classification of the post title and transcript. Based on the topic list from the Electronic News Archive (ENA) of the University of Antwerp, we coded the presence of 19 from politics to sports, with a few platform-specific additions like user-generated performances, which includes typical dance and lip sync videos, or advertisements and promotions.
In addition to looking at individual topics, we categorize content into hard news (politics, crime, war and disasters, economy, and social affairs), and soft news (entertainment, celebrity, lifestyle, fashion, food, pets, and comedy).
News topics
Looking at the overall distribution of topics, hard news such as politics and crime clearly dominate, while typical platform topics like fashion or animals as well as comedy and performance videos are relatively rarely published by news outlets.
Hard news
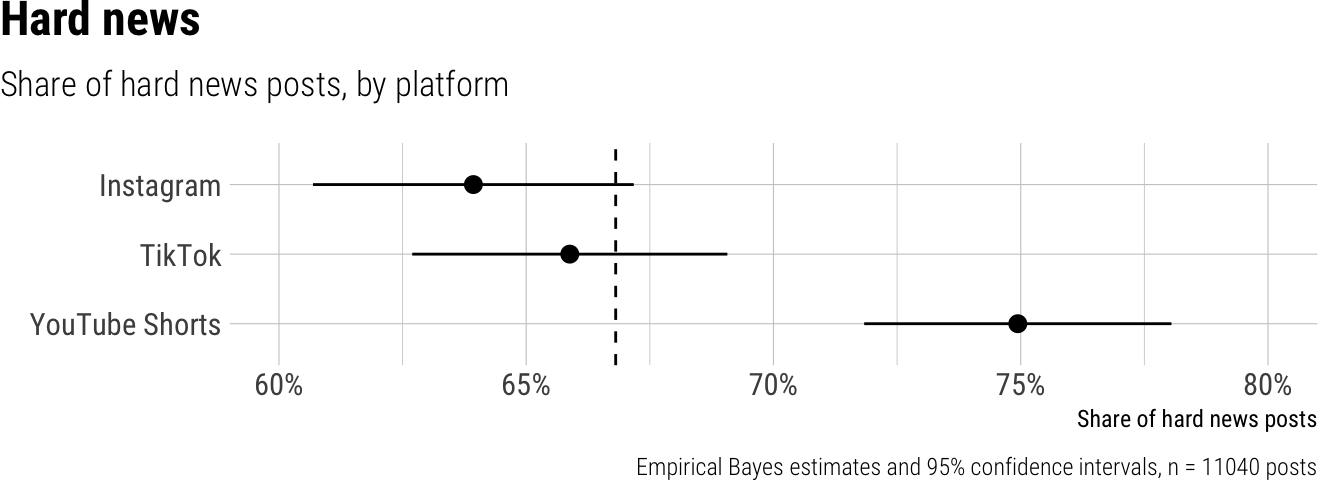
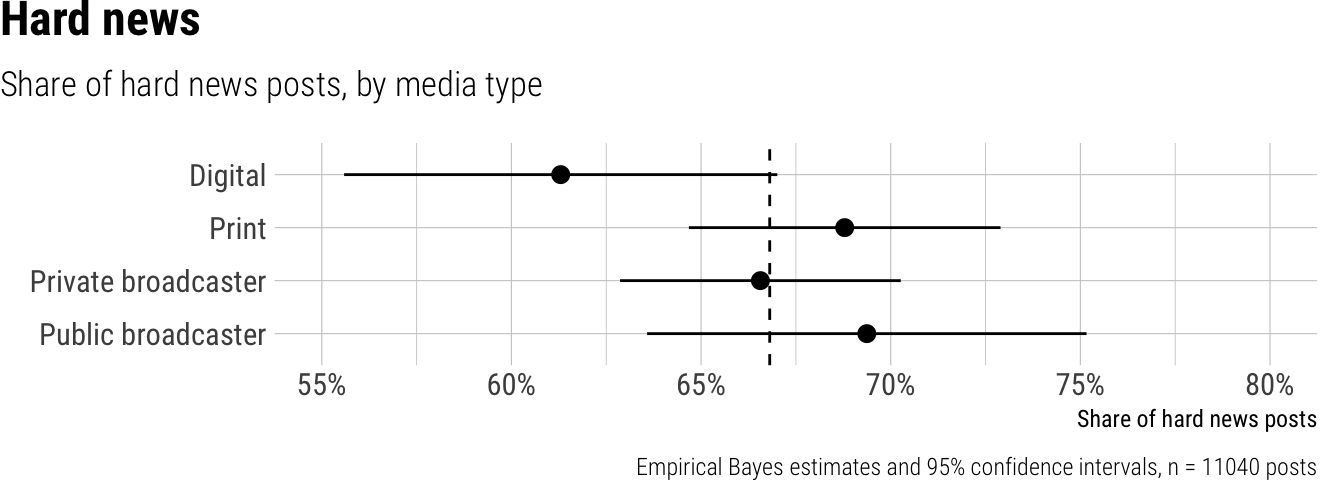
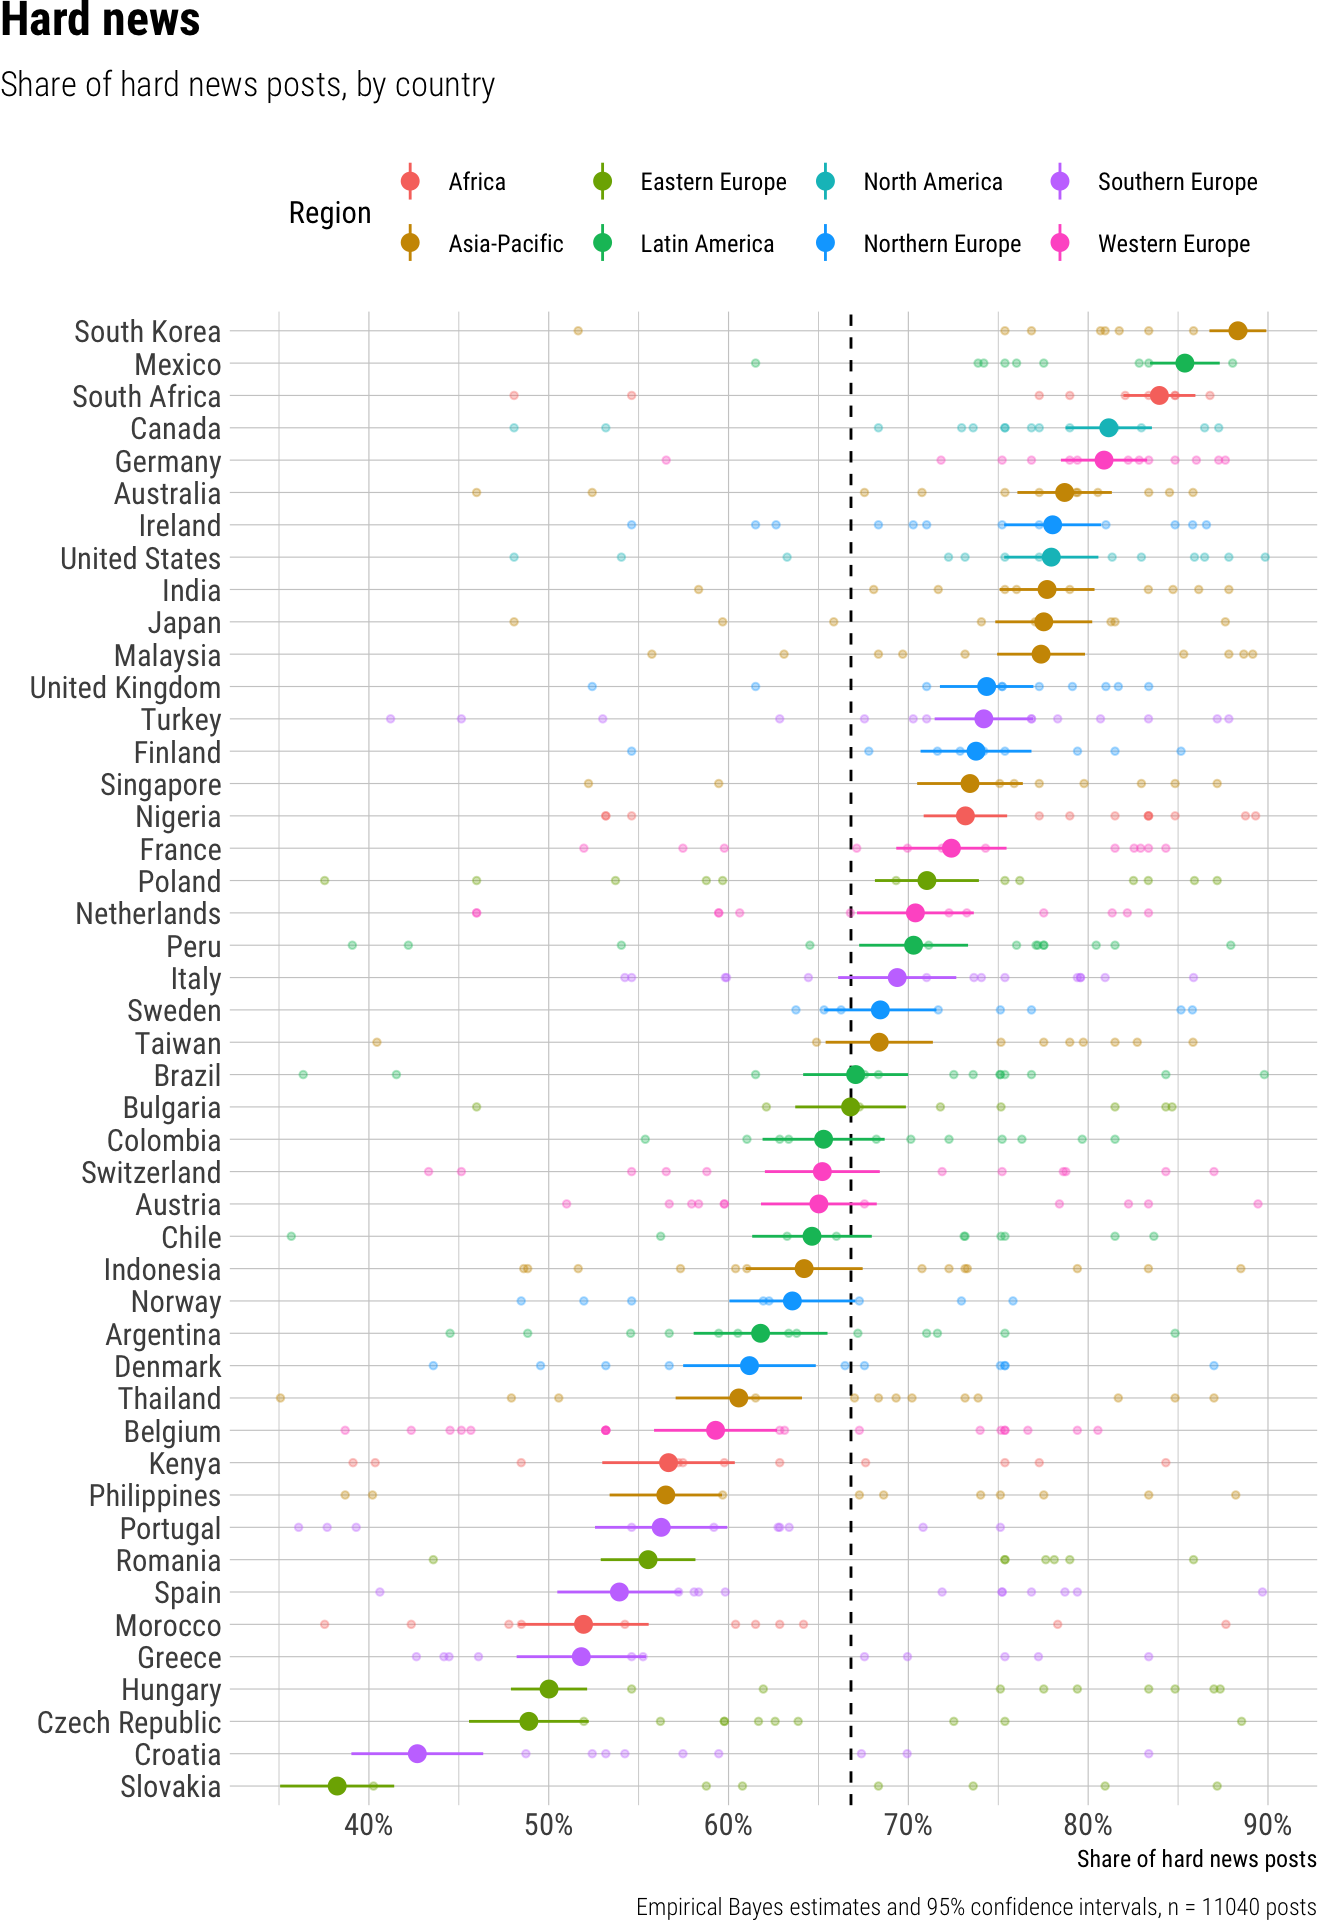
Overall, 67% of short news videos posted by news outlets featured hard news content. Regarding platform, we observed a significant difference: YouTube Shorts displayed hard news in 75% of posts, substantially higher than Instagram’s 64%, while posts on TikTok (at 66%) were not significantly different from Instagram. Differences across outlet types were small and not statistically significant; digital outlets posted hard news in 61% of videos, while print and public broadcasters were slightly higher at 69% each, and private broadcasters at 67%. However, the share of hard news varied considerably by country, ranging from a low of 38% in Slovakia to a high of 88% in South Korea, with other notable highs in Mexico (85%) and Canada (81%).
Result tables for Hard news
Overall average
| estimate | p.value | conf.low | conf.high |
|---|---|---|---|
| 0.67 | 0 | 0.64 | 0.7 |
Contrasts
| term | contrast | estimate | p.value | conf.low | conf.high |
|---|---|---|---|---|---|
| outlet_type | Print - Digital | 0.03 | 0.23 | -0.02 | 0.09 |
| outlet_type | Private broadcaster - Digital | 0.00 | 0.90 | -0.05 | 0.06 |
| outlet_type | Public broadcaster - Digital | -0.03 | 0.42 | -0.10 | 0.04 |
| platform | TikTok - Instagram | 0.00 | 0.98 | -0.02 | 0.02 |
| platform | YouTube Shorts - Instagram | 0.05 | 0.00 | 0.02 | 0.07 |
Predictions by platform
| platform | estimate | p.value | conf.low | conf.high |
|---|---|---|---|---|
| 0.64 | 0 | 0.61 | 0.67 | |
| TikTok | 0.66 | 0 | 0.63 | 0.69 |
| YouTube Shorts | 0.75 | 0 | 0.72 | 0.78 |
Predictions by outlet type
| outlet_type | estimate | p.value | conf.low | conf.high |
|---|---|---|---|---|
| Digital | 0.61 | 0 | 0.56 | 0.67 |
| 0.69 | 0 | 0.65 | 0.73 | |
| Private broadcaster | 0.67 | 0 | 0.63 | 0.70 |
| Public broadcaster | 0.69 | 0 | 0.64 | 0.75 |
Predictions by country
| country | estimate | p.value | conf.low | conf.high | region |
|---|---|---|---|---|---|
| Argentina | 0.62 | 0 | 0.58 | 0.66 | Latin America |
| Australia | 0.79 | 0 | 0.76 | 0.81 | Asia-Pacific |
| Austria | 0.65 | 0 | 0.62 | 0.68 | Western Europe |
| Belgium | 0.59 | 0 | 0.56 | 0.63 | Western Europe |
| Brazil | 0.67 | 0 | 0.64 | 0.70 | Latin America |
| Bulgaria | 0.67 | 0 | 0.64 | 0.70 | Eastern Europe |
| Canada | 0.81 | 0 | 0.79 | 0.84 | North America |
| Chile | 0.65 | 0 | 0.61 | 0.68 | Latin America |
| Colombia | 0.65 | 0 | 0.62 | 0.69 | Latin America |
| Croatia | 0.43 | 0 | 0.39 | 0.46 | Southern Europe |
| Czech Republic | 0.49 | 0 | 0.46 | 0.52 | Eastern Europe |
| Denmark | 0.61 | 0 | 0.57 | 0.65 | Northern Europe |
| Finland | 0.74 | 0 | 0.71 | 0.77 | Northern Europe |
| France | 0.72 | 0 | 0.69 | 0.75 | Western Europe |
| Germany | 0.81 | 0 | 0.78 | 0.83 | Western Europe |
| Greece | 0.52 | 0 | 0.48 | 0.55 | Southern Europe |
| Hungary | 0.50 | 0 | 0.48 | 0.52 | Eastern Europe |
| India | 0.78 | 0 | 0.75 | 0.80 | Asia-Pacific |
| Indonesia | 0.64 | 0 | 0.61 | 0.67 | Asia-Pacific |
| Ireland | 0.78 | 0 | 0.75 | 0.81 | Northern Europe |
| Italy | 0.69 | 0 | 0.66 | 0.73 | Southern Europe |
| Japan | 0.78 | 0 | 0.75 | 0.80 | Asia-Pacific |
| Kenya | 0.57 | 0 | 0.53 | 0.60 | Africa |
| Malaysia | 0.77 | 0 | 0.75 | 0.80 | Asia-Pacific |
| Mexico | 0.85 | 0 | 0.83 | 0.87 | Latin America |
| Morocco | 0.52 | 0 | 0.48 | 0.56 | Africa |
| Netherlands | 0.70 | 0 | 0.67 | 0.74 | Western Europe |
| Nigeria | 0.73 | 0 | 0.71 | 0.75 | Africa |
| Norway | 0.64 | 0 | 0.60 | 0.67 | Northern Europe |
| Peru | 0.70 | 0 | 0.67 | 0.73 | Latin America |
| Philippines | 0.57 | 0 | 0.53 | 0.60 | Asia-Pacific |
| Poland | 0.71 | 0 | 0.68 | 0.74 | Eastern Europe |
| Portugal | 0.56 | 0 | 0.53 | 0.60 | Southern Europe |
| Romania | 0.56 | 0 | 0.53 | 0.58 | Eastern Europe |
| Singapore | 0.73 | 0 | 0.70 | 0.76 | Asia-Pacific |
| Slovakia | 0.38 | 0 | 0.35 | 0.41 | Eastern Europe |
| South Africa | 0.84 | 0 | 0.82 | 0.86 | Africa |
| South Korea | 0.88 | 0 | 0.87 | 0.90 | Asia-Pacific |
| Spain | 0.54 | 0 | 0.50 | 0.57 | Southern Europe |
| Sweden | 0.68 | 0 | 0.65 | 0.72 | Northern Europe |
| Switzerland | 0.65 | 0 | 0.62 | 0.68 | Western Europe |
| Taiwan | 0.68 | 0 | 0.65 | 0.71 | Asia-Pacific |
| Thailand | 0.61 | 0 | 0.57 | 0.64 | Asia-Pacific |
| Turkey | 0.74 | 0 | 0.71 | 0.77 | Southern Europe |
| United Kingdom | 0.74 | 0 | 0.72 | 0.77 | Northern Europe |
| United States | 0.78 | 0 | 0.75 | 0.81 | North America |
Soft news
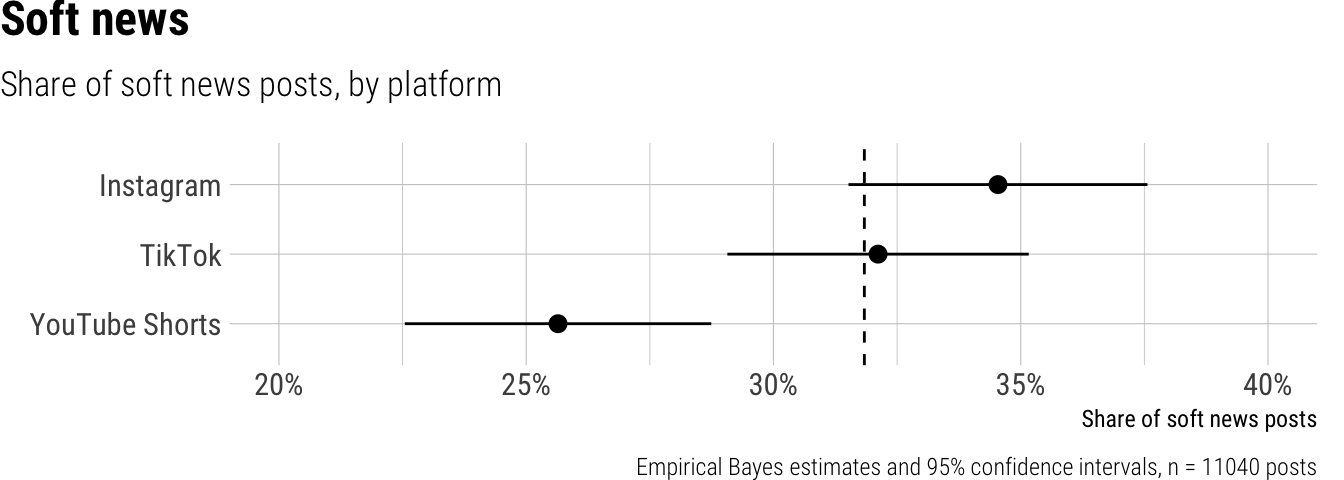
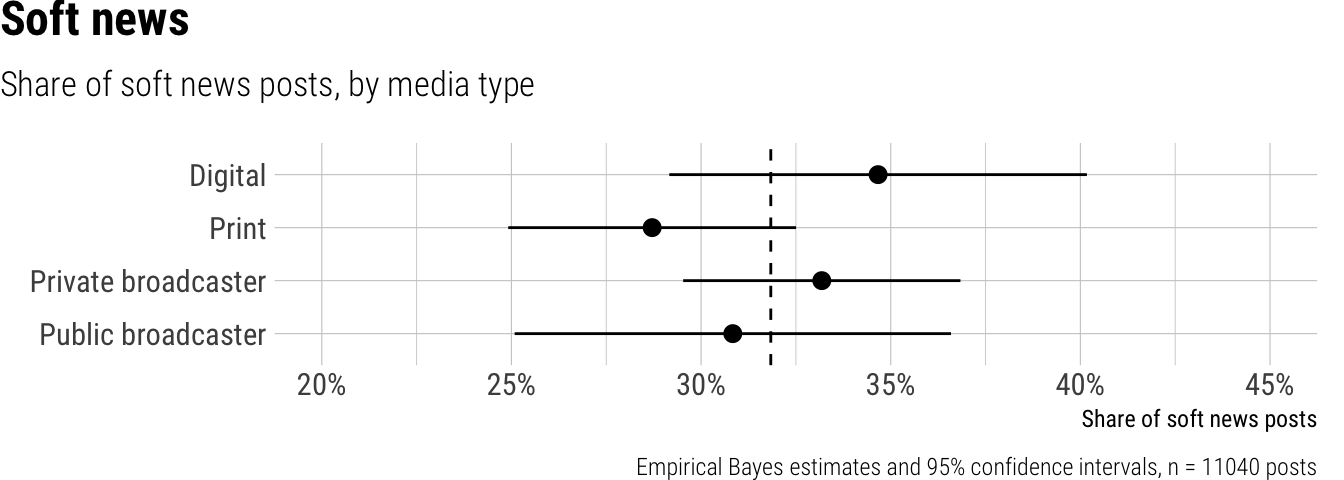
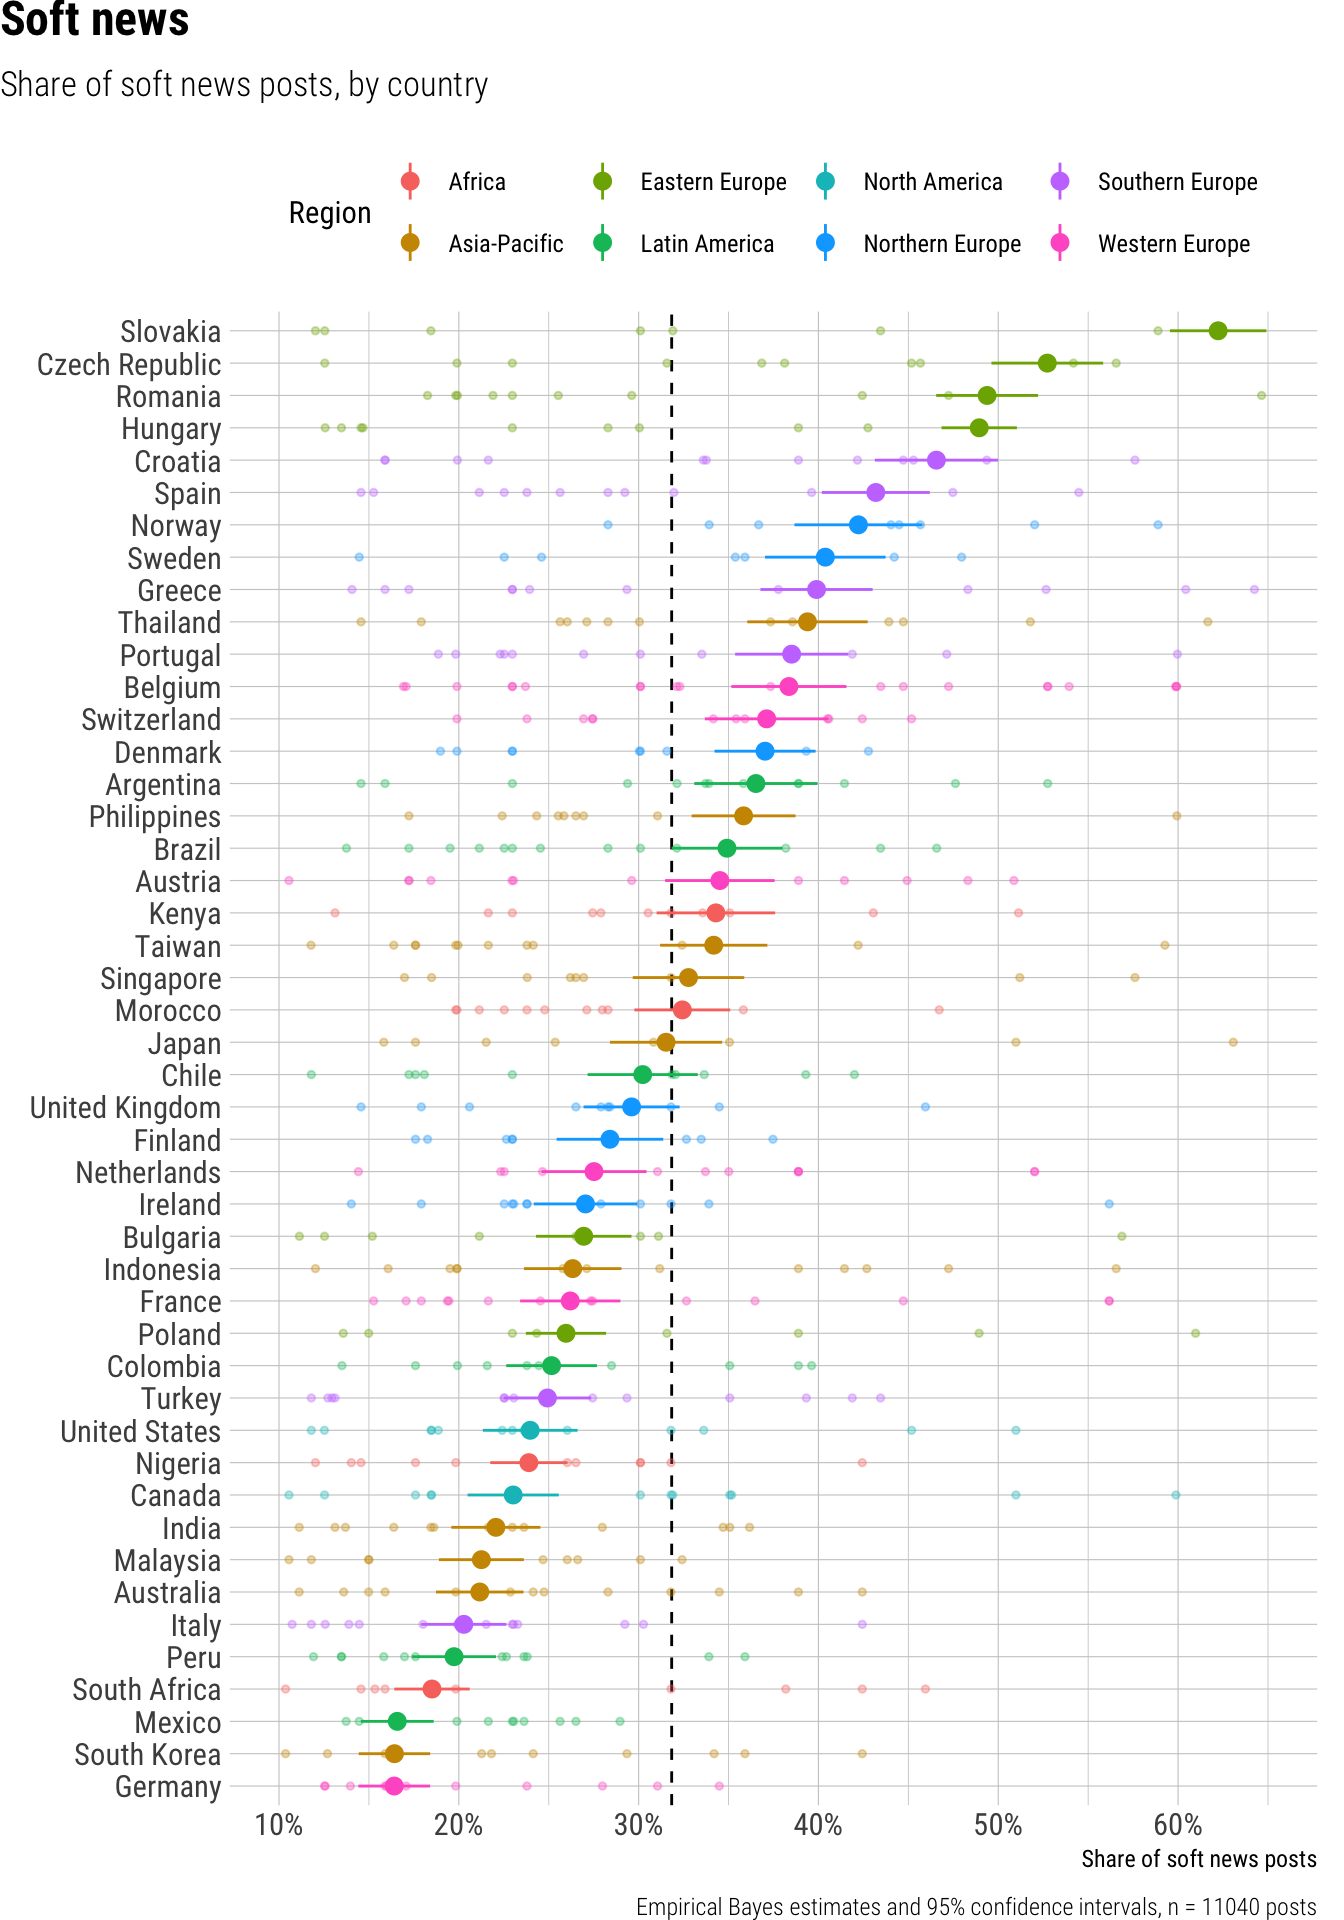
Across all platforms, an average of 32% of short video posts from news outlets were classified as soft news, encompassing entertainment, celebrity, lifestyle, fashion, food, animals, and comedy. We observed notable differences in the share of soft news across platforms, with Instagram featuring the highest proportion at 35%, while YouTube Shorts featured the lowest at 26%, a statistically significant difference. TikTok’s share of soft news posts was 32%. The analysis indicated only small and non-significant differences among various outlet types, including digital outlets, print media, and private or public broadcasters. However, there was a substantial variation in soft news content across different countries; for instance, Germany and South Korea posted the lowest shares, each at 16%, contrasting sharply with Slovakia, where 62% of short video news posts were soft news.
Result tables for Soft news
Overall average
| estimate | p.value | conf.low | conf.high |
|---|---|---|---|
| 0.32 | 0 | 0.29 | 0.35 |
Contrasts
| term | contrast | estimate | p.value | conf.low | conf.high |
|---|---|---|---|---|---|
| outlet_type | Print - Digital | -0.04 | 0.12 | -0.10 | 0.01 |
| outlet_type | Private broadcaster - Digital | 0.01 | 0.82 | -0.05 | 0.06 |
| outlet_type | Public broadcaster - Digital | 0.01 | 0.84 | -0.07 | 0.08 |
| platform | TikTok - Instagram | -0.01 | 0.24 | -0.03 | 0.01 |
| platform | YouTube Shorts - Instagram | -0.06 | 0.00 | -0.08 | -0.03 |
Predictions by platform
| platform | estimate | p.value | conf.low | conf.high |
|---|---|---|---|---|
| 0.35 | 0 | 0.32 | 0.38 | |
| TikTok | 0.32 | 0 | 0.29 | 0.35 |
| YouTube Shorts | 0.26 | 0 | 0.23 | 0.29 |
Predictions by outlet type
| outlet_type | estimate | p.value | conf.low | conf.high |
|---|---|---|---|---|
| Digital | 0.35 | 0 | 0.29 | 0.40 |
| 0.29 | 0 | 0.25 | 0.33 | |
| Private broadcaster | 0.33 | 0 | 0.30 | 0.37 |
| Public broadcaster | 0.31 | 0 | 0.25 | 0.37 |
Predictions by country
| country | estimate | p.value | conf.low | conf.high | region |
|---|---|---|---|---|---|
| Argentina | 0.37 | 0 | 0.33 | 0.40 | Latin America |
| Australia | 0.21 | 0 | 0.19 | 0.24 | Asia-Pacific |
| Austria | 0.35 | 0 | 0.31 | 0.38 | Western Europe |
| Belgium | 0.38 | 0 | 0.35 | 0.42 | Western Europe |
| Brazil | 0.35 | 0 | 0.32 | 0.38 | Latin America |
| Bulgaria | 0.27 | 0 | 0.24 | 0.30 | Eastern Europe |
| Canada | 0.23 | 0 | 0.20 | 0.26 | North America |
| Chile | 0.30 | 0 | 0.27 | 0.33 | Latin America |
| Colombia | 0.25 | 0 | 0.23 | 0.28 | Latin America |
| Croatia | 0.47 | 0 | 0.43 | 0.50 | Southern Europe |
| Czech Republic | 0.53 | 0 | 0.50 | 0.56 | Eastern Europe |
| Denmark | 0.37 | 0 | 0.34 | 0.40 | Northern Europe |
| Finland | 0.28 | 0 | 0.25 | 0.31 | Northern Europe |
| France | 0.26 | 0 | 0.23 | 0.29 | Western Europe |
| Germany | 0.16 | 0 | 0.14 | 0.18 | Western Europe |
| Greece | 0.40 | 0 | 0.37 | 0.43 | Southern Europe |
| Hungary | 0.49 | 0 | 0.47 | 0.51 | Eastern Europe |
| India | 0.22 | 0 | 0.20 | 0.25 | Asia-Pacific |
| Indonesia | 0.26 | 0 | 0.24 | 0.29 | Asia-Pacific |
| Ireland | 0.27 | 0 | 0.24 | 0.30 | Northern Europe |
| Italy | 0.20 | 0 | 0.18 | 0.23 | Southern Europe |
| Japan | 0.32 | 0 | 0.28 | 0.35 | Asia-Pacific |
| Kenya | 0.34 | 0 | 0.31 | 0.38 | Africa |
| Malaysia | 0.21 | 0 | 0.19 | 0.24 | Asia-Pacific |
| Mexico | 0.17 | 0 | 0.15 | 0.19 | Latin America |
| Morocco | 0.32 | 0 | 0.30 | 0.35 | Africa |
| Netherlands | 0.28 | 0 | 0.25 | 0.30 | Western Europe |
| Nigeria | 0.24 | 0 | 0.22 | 0.26 | Africa |
| Norway | 0.42 | 0 | 0.39 | 0.46 | Northern Europe |
| Peru | 0.20 | 0 | 0.17 | 0.22 | Latin America |
| Philippines | 0.36 | 0 | 0.33 | 0.39 | Asia-Pacific |
| Poland | 0.26 | 0 | 0.24 | 0.28 | Eastern Europe |
| Portugal | 0.39 | 0 | 0.35 | 0.42 | Southern Europe |
| Romania | 0.49 | 0 | 0.47 | 0.52 | Eastern Europe |
| Singapore | 0.33 | 0 | 0.30 | 0.36 | Asia-Pacific |
| Slovakia | 0.62 | 0 | 0.60 | 0.65 | Eastern Europe |
| South Africa | 0.19 | 0 | 0.16 | 0.21 | Africa |
| South Korea | 0.16 | 0 | 0.14 | 0.18 | Asia-Pacific |
| Spain | 0.43 | 0 | 0.40 | 0.46 | Southern Europe |
| Sweden | 0.40 | 0 | 0.37 | 0.44 | Northern Europe |
| Switzerland | 0.37 | 0 | 0.34 | 0.41 | Western Europe |
| Taiwan | 0.34 | 0 | 0.31 | 0.37 | Asia-Pacific |
| Thailand | 0.39 | 0 | 0.36 | 0.43 | Asia-Pacific |
| Turkey | 0.25 | 0 | 0.22 | 0.27 | Southern Europe |
| United Kingdom | 0.30 | 0 | 0.27 | 0.32 | Northern Europe |
| United States | 0.24 | 0 | 0.21 | 0.27 | North America |
Topic details
In the subsections below, we provide detailed information about all coded news topics, along with comparisons by platform, media type and country.
Politics
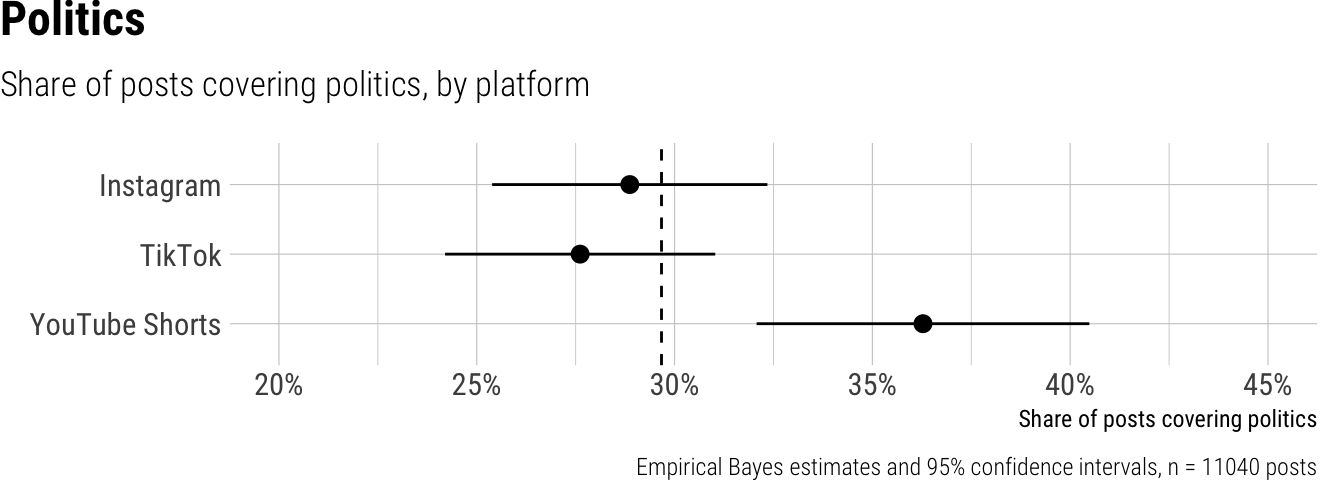
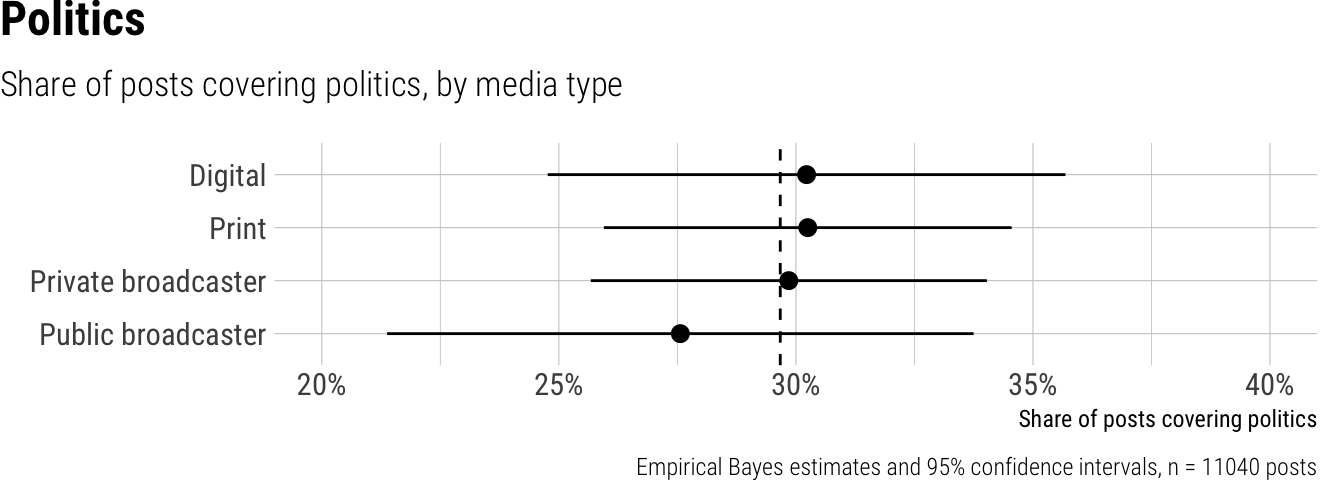
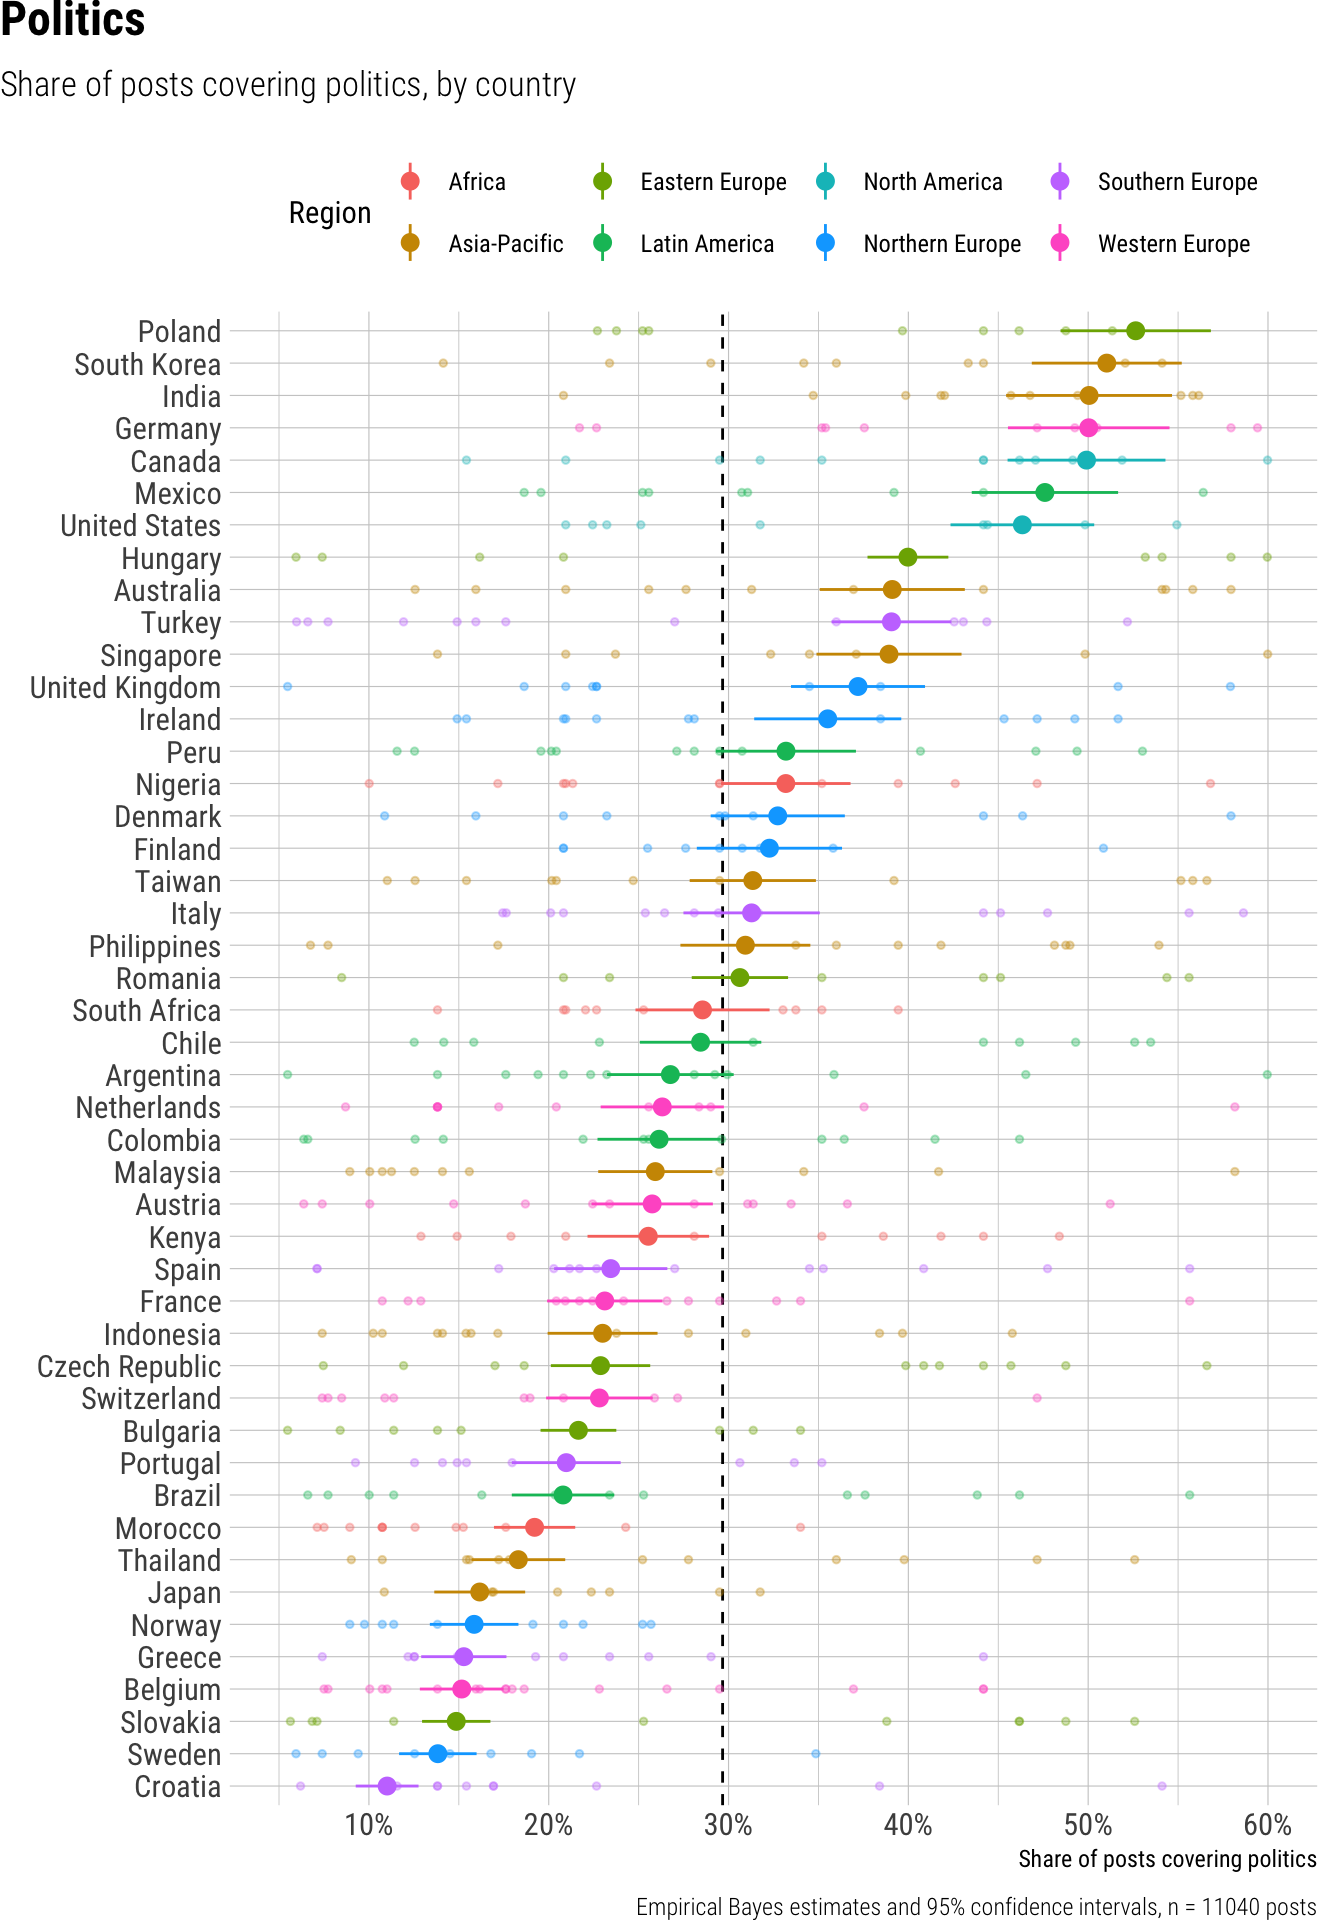
The analysis of short video posts found that, on average, 30% of content covered politics. Considering platform differences, YouTube Shorts featured a higher share of political coverage at 36%, whereas Instagram and TikTok posted political content at approximately 28-29%, with no significant difference between these two platforms. Regarding outlet types, public broadcasters dedicated a slightly lower share of their posts to politics at 28%, which was 8 percentage points less than digital outlets, while print and private broadcasters all hovered around 30%. We also observed substantial variation across countries, with the share of political posts ranging from a low of 11% in Croatia to highs of 53% in Poland, 51% in South Korea, and approximately 50% in Canada, Germany, and India.
Result tables for Topic: Politics
Overall average
| estimate | p.value | conf.low | conf.high |
|---|---|---|---|
| 0.3 | 0 | 0.26 | 0.33 |
Contrasts
| term | contrast | estimate | p.value | conf.low | conf.high |
|---|---|---|---|---|---|
| outlet_type | Print - Digital | -0.02 | 0.43 | -0.08 | 0.04 |
| outlet_type | Private broadcaster - Digital | -0.06 | 0.06 | -0.12 | 0.00 |
| outlet_type | Public broadcaster - Digital | -0.08 | 0.03 | -0.15 | -0.01 |
| platform | TikTok - Instagram | -0.01 | 0.17 | -0.03 | 0.01 |
| platform | YouTube Shorts - Instagram | 0.02 | 0.13 | -0.01 | 0.04 |
Predictions by platform
| platform | estimate | p.value | conf.low | conf.high |
|---|---|---|---|---|
| 0.29 | 0 | 0.25 | 0.32 | |
| TikTok | 0.28 | 0 | 0.24 | 0.31 |
| YouTube Shorts | 0.36 | 0 | 0.32 | 0.40 |
Predictions by outlet type
| outlet_type | estimate | p.value | conf.low | conf.high |
|---|---|---|---|---|
| Digital | 0.30 | 0 | 0.25 | 0.36 |
| 0.30 | 0 | 0.26 | 0.35 | |
| Private broadcaster | 0.30 | 0 | 0.26 | 0.34 |
| Public broadcaster | 0.28 | 0 | 0.21 | 0.34 |
Predictions by country
| country | estimate | p.value | conf.low | conf.high | region |
|---|---|---|---|---|---|
| Argentina | 0.27 | 0 | 0.23 | 0.30 | Latin America |
| Australia | 0.39 | 0 | 0.35 | 0.43 | Asia-Pacific |
| Austria | 0.26 | 0 | 0.22 | 0.29 | Western Europe |
| Belgium | 0.15 | 0 | 0.13 | 0.17 | Western Europe |
| Brazil | 0.21 | 0 | 0.18 | 0.24 | Latin America |
| Bulgaria | 0.22 | 0 | 0.20 | 0.24 | Eastern Europe |
| Canada | 0.50 | 0 | 0.46 | 0.54 | North America |
| Chile | 0.28 | 0 | 0.25 | 0.32 | Latin America |
| Colombia | 0.26 | 0 | 0.23 | 0.30 | Latin America |
| Croatia | 0.11 | 0 | 0.09 | 0.13 | Southern Europe |
| Czech Republic | 0.23 | 0 | 0.20 | 0.26 | Eastern Europe |
| Denmark | 0.33 | 0 | 0.29 | 0.36 | Northern Europe |
| Finland | 0.32 | 0 | 0.28 | 0.36 | Northern Europe |
| France | 0.23 | 0 | 0.20 | 0.26 | Western Europe |
| Germany | 0.50 | 0 | 0.46 | 0.55 | Western Europe |
| Greece | 0.15 | 0 | 0.13 | 0.18 | Southern Europe |
| Hungary | 0.40 | 0 | 0.38 | 0.42 | Eastern Europe |
| India | 0.50 | 0 | 0.45 | 0.55 | Asia-Pacific |
| Indonesia | 0.23 | 0 | 0.20 | 0.26 | Asia-Pacific |
| Ireland | 0.36 | 0 | 0.31 | 0.40 | Northern Europe |
| Italy | 0.31 | 0 | 0.27 | 0.35 | Southern Europe |
| Japan | 0.16 | 0 | 0.14 | 0.19 | Asia-Pacific |
| Kenya | 0.26 | 0 | 0.22 | 0.29 | Africa |
| Malaysia | 0.26 | 0 | 0.23 | 0.29 | Asia-Pacific |
| Mexico | 0.48 | 0 | 0.44 | 0.52 | Latin America |
| Morocco | 0.19 | 0 | 0.17 | 0.21 | Africa |
| Netherlands | 0.26 | 0 | 0.23 | 0.30 | Western Europe |
| Nigeria | 0.33 | 0 | 0.30 | 0.37 | Africa |
| Norway | 0.16 | 0 | 0.13 | 0.18 | Northern Europe |
| Peru | 0.33 | 0 | 0.29 | 0.37 | Latin America |
| Philippines | 0.31 | 0 | 0.27 | 0.35 | Asia-Pacific |
| Poland | 0.53 | 0 | 0.48 | 0.57 | Eastern Europe |
| Portugal | 0.21 | 0 | 0.18 | 0.24 | Southern Europe |
| Romania | 0.31 | 0 | 0.28 | 0.33 | Eastern Europe |
| Singapore | 0.39 | 0 | 0.35 | 0.43 | Asia-Pacific |
| Slovakia | 0.15 | 0 | 0.13 | 0.17 | Eastern Europe |
| South Africa | 0.29 | 0 | 0.25 | 0.32 | Africa |
| South Korea | 0.51 | 0 | 0.47 | 0.55 | Asia-Pacific |
| Spain | 0.23 | 0 | 0.20 | 0.27 | Southern Europe |
| Sweden | 0.14 | 0 | 0.12 | 0.16 | Northern Europe |
| Switzerland | 0.23 | 0 | 0.20 | 0.26 | Western Europe |
| Taiwan | 0.31 | 0 | 0.28 | 0.35 | Asia-Pacific |
| Thailand | 0.18 | 0 | 0.16 | 0.21 | Asia-Pacific |
| Turkey | 0.39 | 0 | 0.36 | 0.42 | Southern Europe |
| United Kingdom | 0.37 | 0 | 0.33 | 0.41 | Northern Europe |
| United States | 0.46 | 0 | 0.42 | 0.50 | North America |
Law Enforcement and Crime
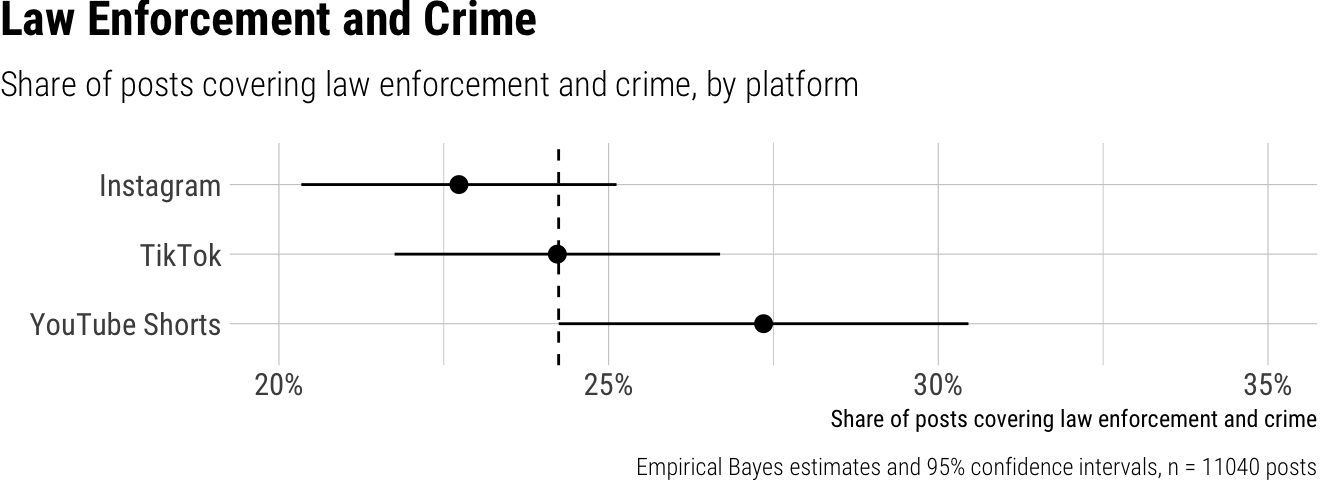
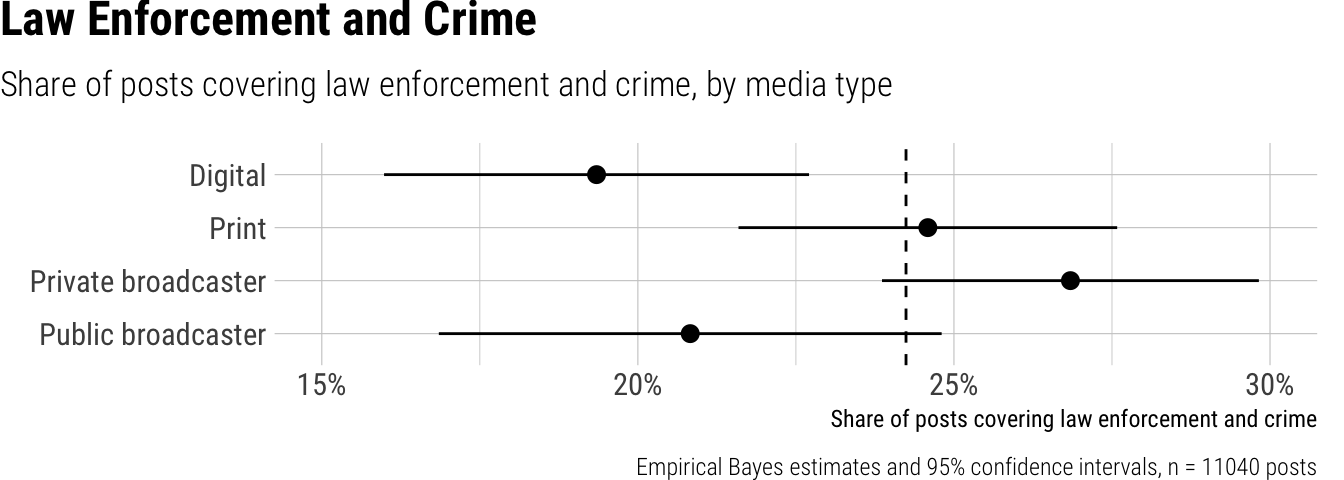
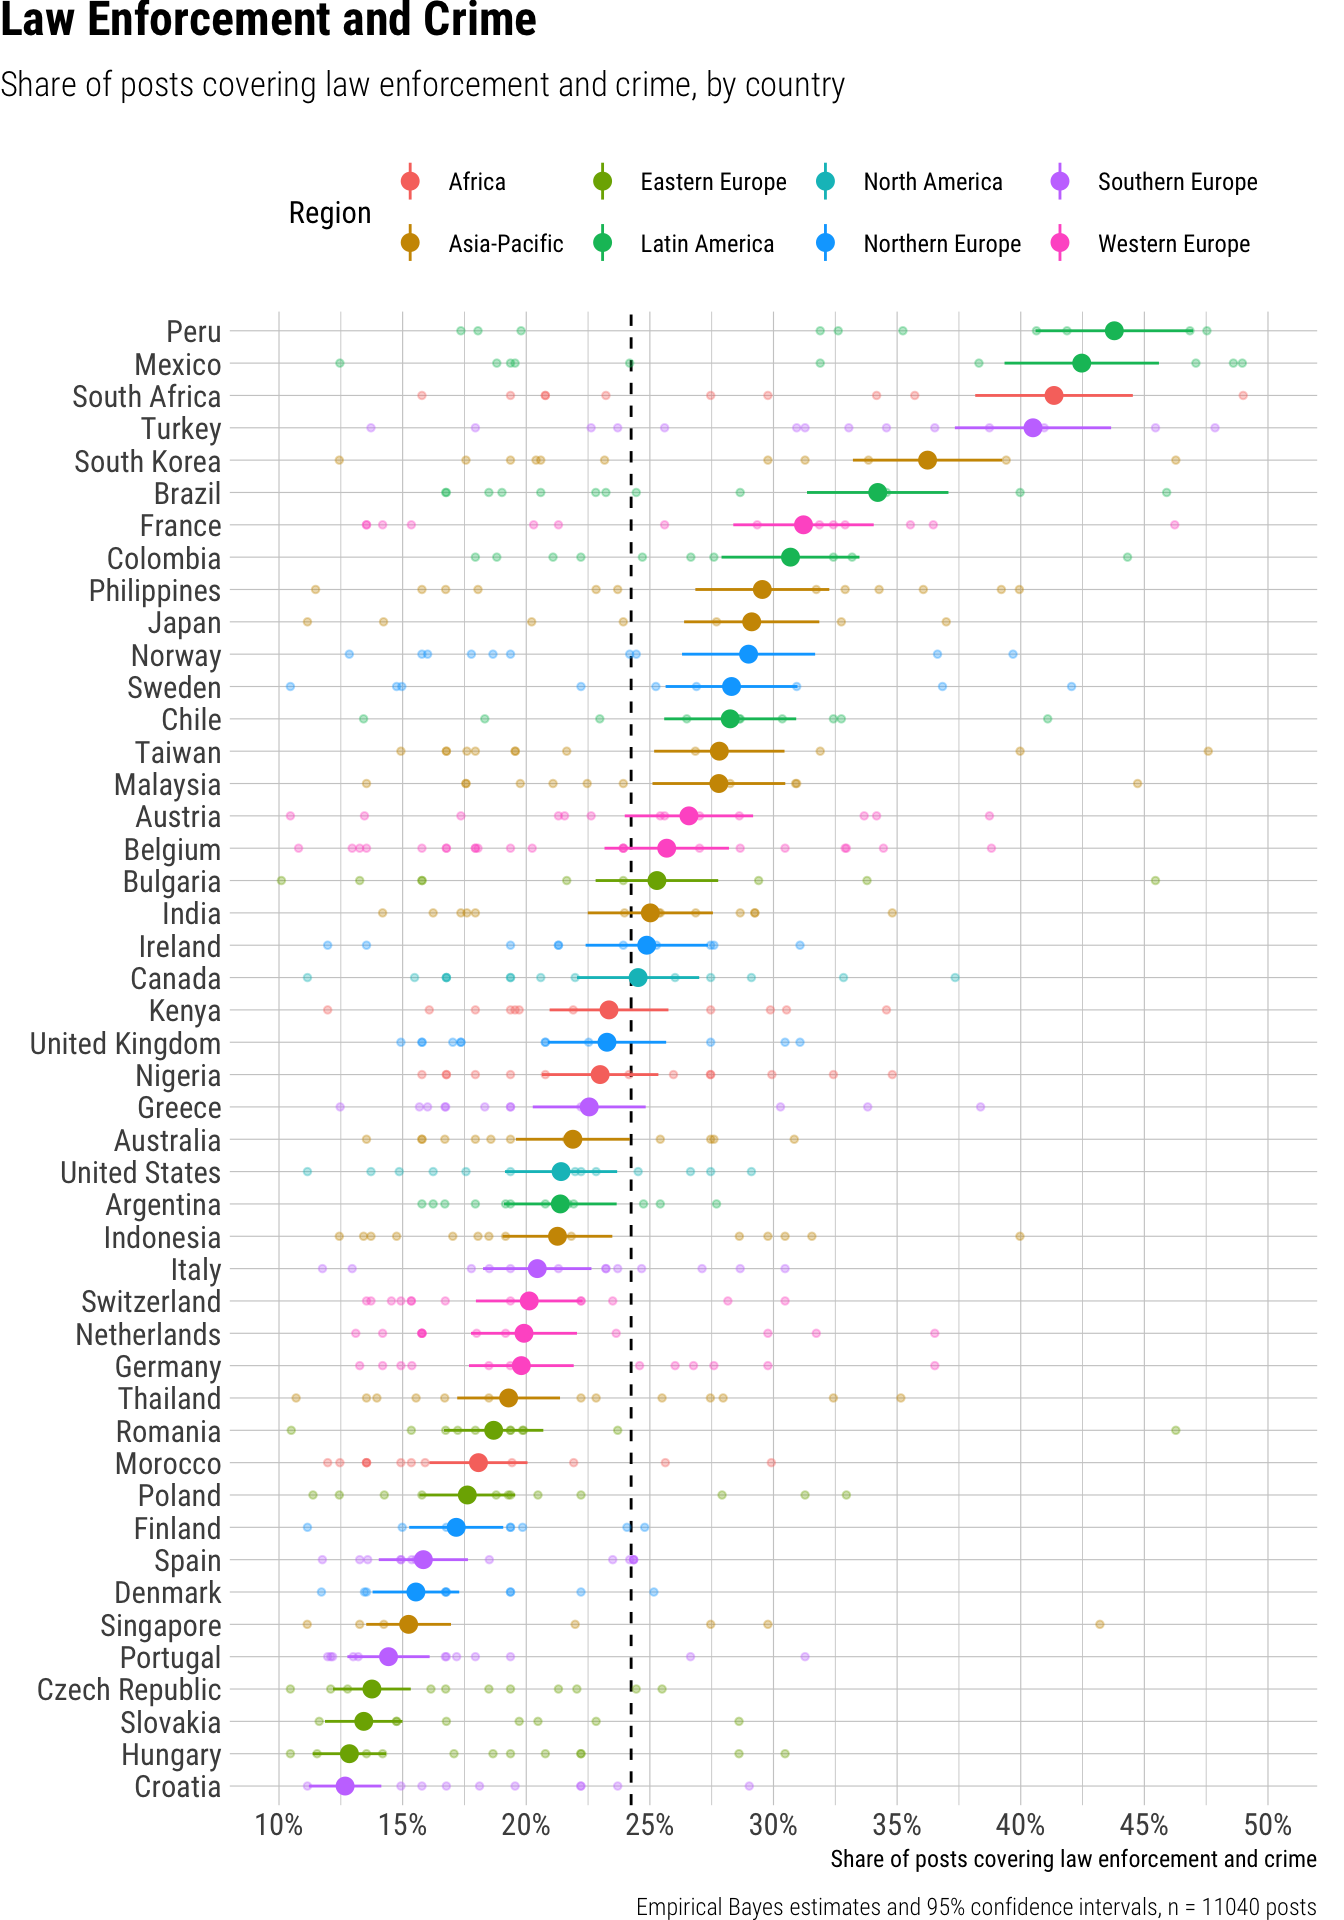
Overall, short video posts from news outlets dedicated an average of 24% of their content to law enforcement and crime. While we observed generally small differences across platforms—with Instagram showing 23%, TikTok 24%, and YouTube Shorts slightly higher at 27%—more substantial variations emerged when comparing outlet types. Print outlets and private broadcasters dedicated a significantly larger share of their posts to this topic than digital outlets. Specifically, private broadcasters allocated 27% of their content to law enforcement and crime, and print outlets 25%, both notably higher than the 19% observed for digital news providers, while public broadcasters showed a share of 21%. Significant disparities also appeared across countries, with the share of law enforcement and crime content ranging from a low of 13% in Croatia, Hungary, and Slovakia, to a high of 44% in Peru and 42% in Mexico. Other countries with a particularly high focus included South Africa (41%), Turkey (40%), and South Korea (36%).
Result tables for Topic: Law
Overall average
| estimate | p.value | conf.low | conf.high |
|---|---|---|---|
| 0.24 | 0 | 0.22 | 0.27 |
Contrasts
| term | contrast | estimate | p.value | conf.low | conf.high |
|---|---|---|---|---|---|
| outlet_type | Print - Digital | 0.04 | 0.04 | 0.00 | 0.08 |
| outlet_type | Private broadcaster - Digital | 0.05 | 0.02 | 0.01 | 0.09 |
| outlet_type | Public broadcaster - Digital | -0.02 | 0.40 | -0.07 | 0.03 |
| platform | TikTok - Instagram | 0.00 | 0.78 | -0.02 | 0.02 |
| platform | YouTube Shorts - Instagram | 0.02 | 0.18 | -0.01 | 0.04 |
Predictions by platform
| platform | estimate | p.value | conf.low | conf.high |
|---|---|---|---|---|
| 0.23 | 0 | 0.20 | 0.25 | |
| TikTok | 0.24 | 0 | 0.22 | 0.27 |
| YouTube Shorts | 0.27 | 0 | 0.24 | 0.30 |
Predictions by outlet type
| outlet_type | estimate | p.value | conf.low | conf.high |
|---|---|---|---|---|
| Digital | 0.19 | 0 | 0.16 | 0.23 |
| 0.25 | 0 | 0.22 | 0.28 | |
| Private broadcaster | 0.27 | 0 | 0.24 | 0.30 |
| Public broadcaster | 0.21 | 0 | 0.17 | 0.25 |
Predictions by country
| country | estimate | p.value | conf.low | conf.high | region |
|---|---|---|---|---|---|
| Argentina | 0.21 | 0 | 0.19 | 0.24 | Latin America |
| Australia | 0.22 | 0 | 0.20 | 0.24 | Asia-Pacific |
| Austria | 0.27 | 0 | 0.24 | 0.29 | Western Europe |
| Belgium | 0.26 | 0 | 0.23 | 0.28 | Western Europe |
| Brazil | 0.34 | 0 | 0.31 | 0.37 | Latin America |
| Bulgaria | 0.25 | 0 | 0.23 | 0.28 | Eastern Europe |
| Canada | 0.25 | 0 | 0.22 | 0.27 | North America |
| Chile | 0.28 | 0 | 0.26 | 0.31 | Latin America |
| Colombia | 0.31 | 0 | 0.28 | 0.33 | Latin America |
| Croatia | 0.13 | 0 | 0.11 | 0.14 | Southern Europe |
| Czech Republic | 0.14 | 0 | 0.12 | 0.15 | Eastern Europe |
| Denmark | 0.16 | 0 | 0.14 | 0.17 | Northern Europe |
| Finland | 0.17 | 0 | 0.15 | 0.19 | Northern Europe |
| France | 0.31 | 0 | 0.28 | 0.34 | Western Europe |
| Germany | 0.20 | 0 | 0.18 | 0.22 | Western Europe |
| Greece | 0.23 | 0 | 0.20 | 0.25 | Southern Europe |
| Hungary | 0.13 | 0 | 0.11 | 0.14 | Eastern Europe |
| India | 0.25 | 0 | 0.22 | 0.28 | Asia-Pacific |
| Indonesia | 0.21 | 0 | 0.19 | 0.23 | Asia-Pacific |
| Ireland | 0.25 | 0 | 0.22 | 0.27 | Northern Europe |
| Italy | 0.20 | 0 | 0.18 | 0.23 | Southern Europe |
| Japan | 0.29 | 0 | 0.26 | 0.32 | Asia-Pacific |
| Kenya | 0.23 | 0 | 0.21 | 0.26 | Africa |
| Malaysia | 0.28 | 0 | 0.25 | 0.30 | Asia-Pacific |
| Mexico | 0.42 | 0 | 0.39 | 0.46 | Latin America |
| Morocco | 0.18 | 0 | 0.16 | 0.20 | Africa |
| Netherlands | 0.20 | 0 | 0.18 | 0.22 | Western Europe |
| Nigeria | 0.23 | 0 | 0.21 | 0.25 | Africa |
| Norway | 0.29 | 0 | 0.26 | 0.32 | Northern Europe |
| Peru | 0.44 | 0 | 0.41 | 0.47 | Latin America |
| Philippines | 0.30 | 0 | 0.27 | 0.32 | Asia-Pacific |
| Poland | 0.18 | 0 | 0.16 | 0.20 | Eastern Europe |
| Portugal | 0.14 | 0 | 0.13 | 0.16 | Southern Europe |
| Romania | 0.19 | 0 | 0.17 | 0.21 | Eastern Europe |
| Singapore | 0.15 | 0 | 0.14 | 0.17 | Asia-Pacific |
| Slovakia | 0.13 | 0 | 0.12 | 0.15 | Eastern Europe |
| South Africa | 0.41 | 0 | 0.38 | 0.45 | Africa |
| South Korea | 0.36 | 0 | 0.33 | 0.39 | Asia-Pacific |
| Spain | 0.16 | 0 | 0.14 | 0.18 | Southern Europe |
| Sweden | 0.28 | 0 | 0.26 | 0.31 | Northern Europe |
| Switzerland | 0.20 | 0 | 0.18 | 0.22 | Western Europe |
| Taiwan | 0.28 | 0 | 0.25 | 0.30 | Asia-Pacific |
| Thailand | 0.19 | 0 | 0.17 | 0.21 | Asia-Pacific |
| Turkey | 0.40 | 0 | 0.37 | 0.44 | Southern Europe |
| United Kingdom | 0.23 | 0 | 0.21 | 0.26 | Northern Europe |
| United States | 0.21 | 0 | 0.19 | 0.24 | North America |
War, Disasters, and Accidents
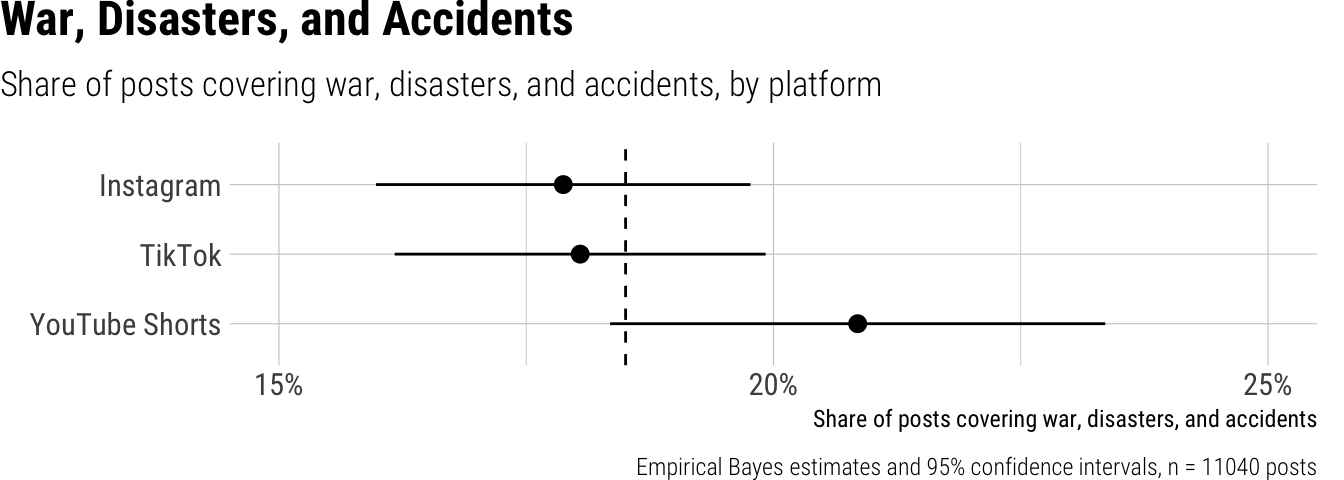
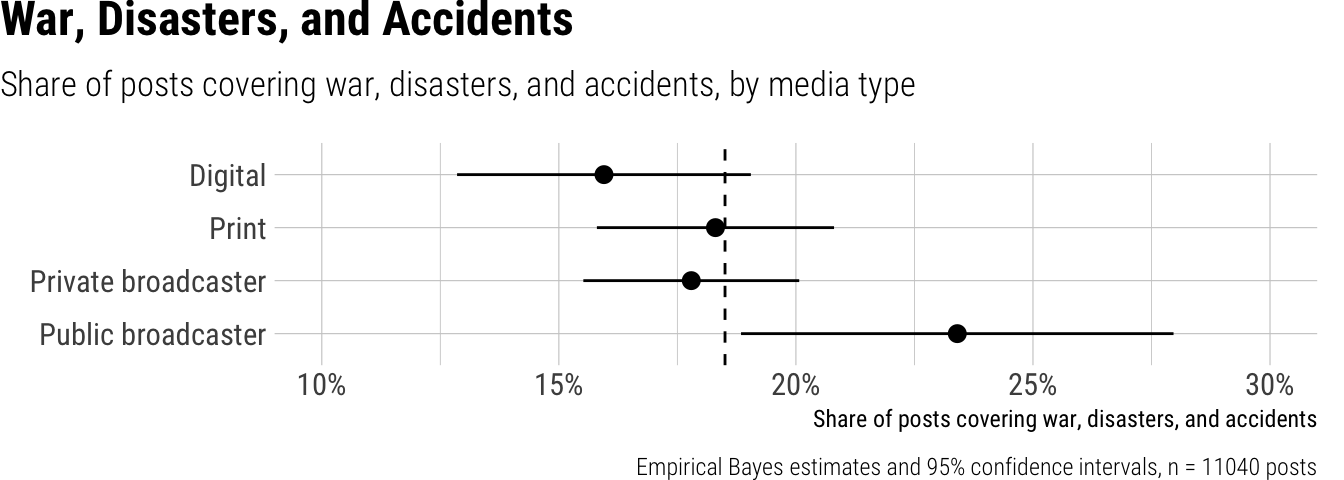
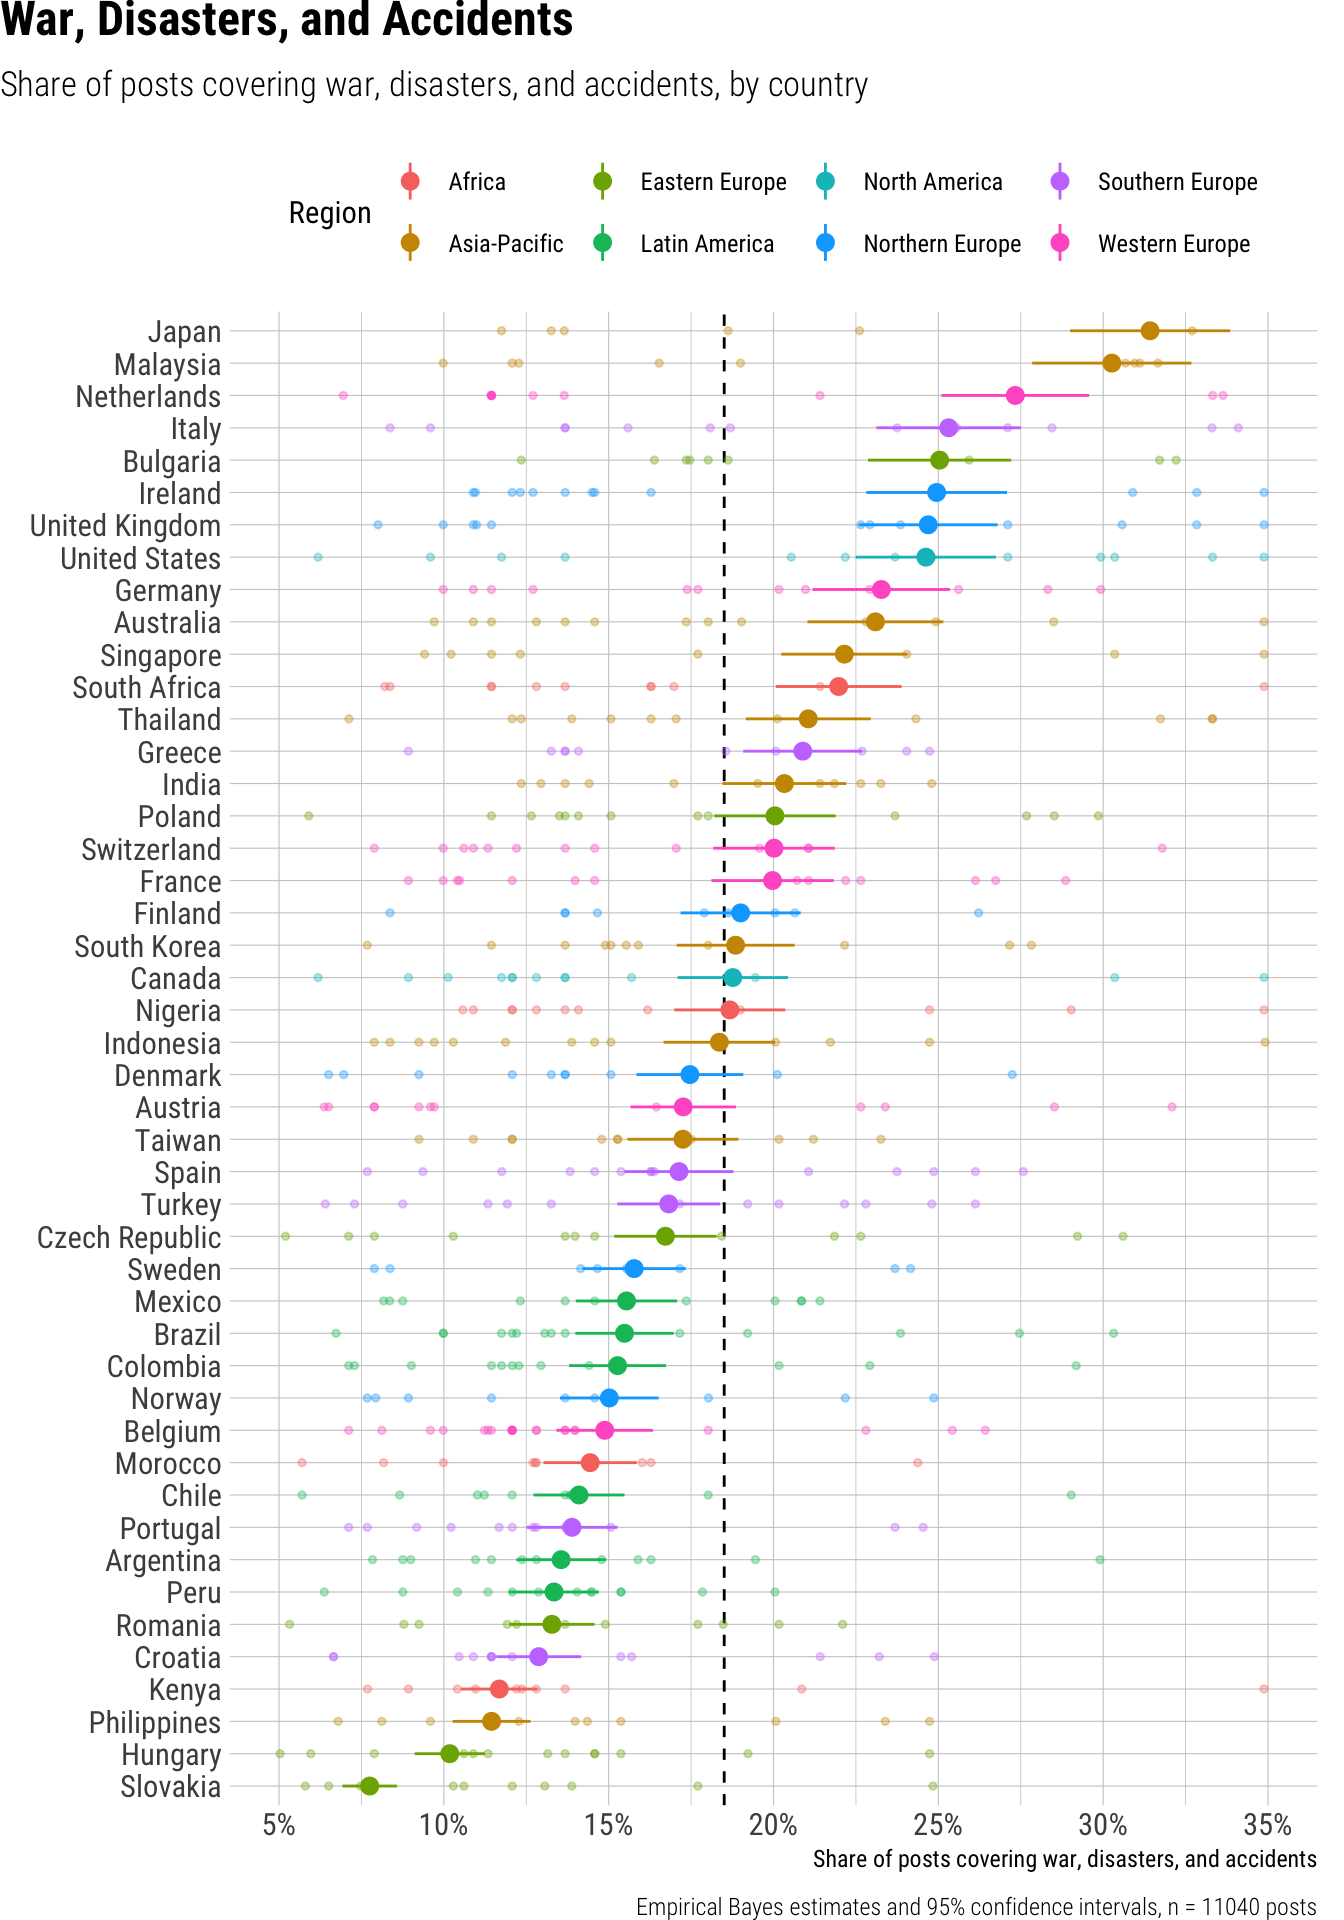
Across news outlets worldwide, approximately 19% of short video posts covered war, disasters, and accidents. When examining platform use, we saw only modest differences: YouTube Shorts featured this content in 21% of its posts, slightly more than Instagram and TikTok, which both showed 18%. Outlet type revealed more notable variations, with public broadcasters dedicating 23% of their short videos to these topics, a higher proportion than digital outlets (16%), print outlets (18%), and private broadcasters (18%). The share of these topics varied widely by country, ranging from a low of 8% in Slovakia to a high of 31% in Japan and 30% in Malaysia, with countries like the United States and the United Kingdom showing 25%.
Result tables for Topic: War
Overall average
| estimate | p.value | conf.low | conf.high |
|---|---|---|---|
| 0.19 | 0 | 0.17 | 0.2 |
Contrasts
| term | contrast | estimate | p.value | conf.low | conf.high |
|---|---|---|---|---|---|
| outlet_type | Print - Digital | 0.02 | 0.40 | -0.02 | 0.06 |
| outlet_type | Private broadcaster - Digital | 0.01 | 0.48 | -0.02 | 0.05 |
| outlet_type | Public broadcaster - Digital | 0.03 | 0.30 | -0.02 | 0.08 |
| platform | TikTok - Instagram | -0.01 | 0.39 | -0.02 | 0.01 |
| platform | YouTube Shorts - Instagram | 0.02 | 0.13 | -0.01 | 0.04 |
Predictions by platform
| platform | estimate | p.value | conf.low | conf.high |
|---|---|---|---|---|
| 0.18 | 0 | 0.16 | 0.20 | |
| TikTok | 0.18 | 0 | 0.16 | 0.20 |
| YouTube Shorts | 0.21 | 0 | 0.18 | 0.23 |
Predictions by outlet type
| outlet_type | estimate | p.value | conf.low | conf.high |
|---|---|---|---|---|
| Digital | 0.16 | 0 | 0.13 | 0.19 |
| 0.18 | 0 | 0.16 | 0.21 | |
| Private broadcaster | 0.18 | 0 | 0.16 | 0.20 |
| Public broadcaster | 0.23 | 0 | 0.19 | 0.28 |
Predictions by country
| country | estimate | p.value | conf.low | conf.high | region |
|---|---|---|---|---|---|
| Argentina | 0.14 | 0 | 0.12 | 0.15 | Latin America |
| Australia | 0.23 | 0 | 0.21 | 0.25 | Asia-Pacific |
| Austria | 0.17 | 0 | 0.16 | 0.19 | Western Europe |
| Belgium | 0.15 | 0 | 0.13 | 0.16 | Western Europe |
| Brazil | 0.15 | 0 | 0.14 | 0.17 | Latin America |
| Bulgaria | 0.25 | 0 | 0.23 | 0.27 | Eastern Europe |
| Canada | 0.19 | 0 | 0.17 | 0.20 | North America |
| Chile | 0.14 | 0 | 0.13 | 0.15 | Latin America |
| Colombia | 0.15 | 0 | 0.14 | 0.17 | Latin America |
| Croatia | 0.13 | 0 | 0.12 | 0.14 | Southern Europe |
| Czech Republic | 0.17 | 0 | 0.15 | 0.18 | Eastern Europe |
| Denmark | 0.17 | 0 | 0.16 | 0.19 | Northern Europe |
| Finland | 0.19 | 0 | 0.17 | 0.21 | Northern Europe |
| France | 0.20 | 0 | 0.18 | 0.22 | Western Europe |
| Germany | 0.23 | 0 | 0.21 | 0.25 | Western Europe |
| Greece | 0.21 | 0 | 0.19 | 0.23 | Southern Europe |
| Hungary | 0.10 | 0 | 0.09 | 0.11 | Eastern Europe |
| India | 0.20 | 0 | 0.18 | 0.22 | Asia-Pacific |
| Indonesia | 0.18 | 0 | 0.17 | 0.20 | Asia-Pacific |
| Ireland | 0.25 | 0 | 0.23 | 0.27 | Northern Europe |
| Italy | 0.25 | 0 | 0.23 | 0.28 | Southern Europe |
| Japan | 0.31 | 0 | 0.29 | 0.34 | Asia-Pacific |
| Kenya | 0.12 | 0 | 0.11 | 0.13 | Africa |
| Malaysia | 0.30 | 0 | 0.28 | 0.33 | Asia-Pacific |
| Mexico | 0.16 | 0 | 0.14 | 0.17 | Latin America |
| Morocco | 0.14 | 0 | 0.13 | 0.16 | Africa |
| Netherlands | 0.27 | 0 | 0.25 | 0.30 | Western Europe |
| Nigeria | 0.19 | 0 | 0.17 | 0.20 | Africa |
| Norway | 0.15 | 0 | 0.14 | 0.17 | Northern Europe |
| Peru | 0.13 | 0 | 0.12 | 0.15 | Latin America |
| Philippines | 0.11 | 0 | 0.10 | 0.13 | Asia-Pacific |
| Poland | 0.20 | 0 | 0.18 | 0.22 | Eastern Europe |
| Portugal | 0.14 | 0 | 0.13 | 0.15 | Southern Europe |
| Romania | 0.13 | 0 | 0.12 | 0.15 | Eastern Europe |
| Singapore | 0.22 | 0 | 0.20 | 0.24 | Asia-Pacific |
| Slovakia | 0.08 | 0 | 0.07 | 0.09 | Eastern Europe |
| South Africa | 0.22 | 0 | 0.20 | 0.24 | Africa |
| South Korea | 0.19 | 0 | 0.17 | 0.21 | Asia-Pacific |
| Spain | 0.17 | 0 | 0.15 | 0.19 | Southern Europe |
| Sweden | 0.16 | 0 | 0.14 | 0.17 | Northern Europe |
| Switzerland | 0.20 | 0 | 0.18 | 0.22 | Western Europe |
| Taiwan | 0.17 | 0 | 0.16 | 0.19 | Asia-Pacific |
| Thailand | 0.21 | 0 | 0.19 | 0.23 | Asia-Pacific |
| Turkey | 0.17 | 0 | 0.15 | 0.18 | Southern Europe |
| United Kingdom | 0.25 | 0 | 0.23 | 0.27 | Northern Europe |
| United States | 0.25 | 0 | 0.22 | 0.27 | North America |
Economy and Finance
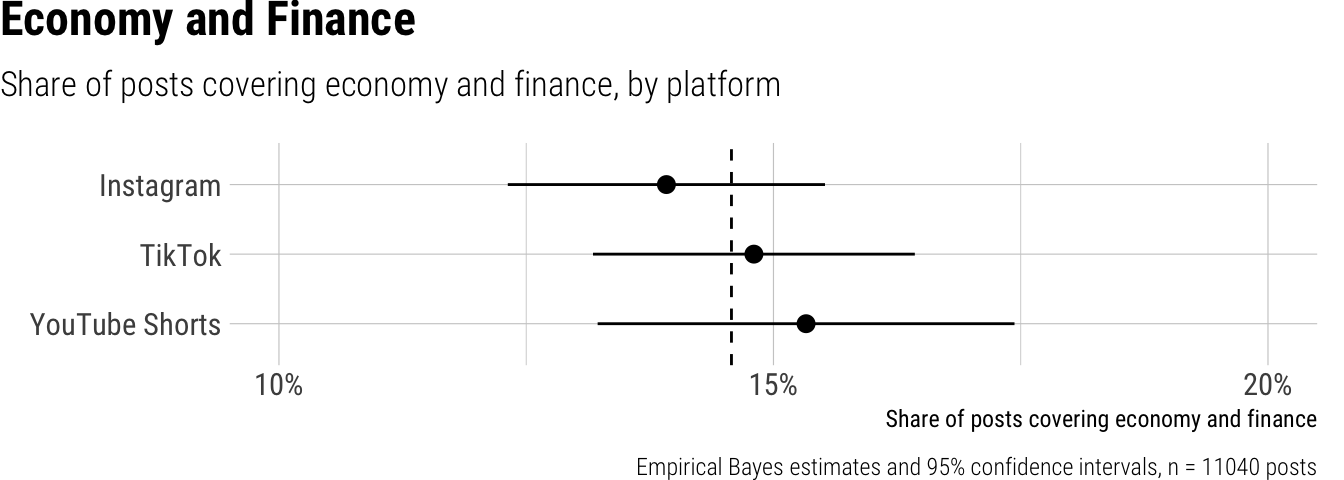
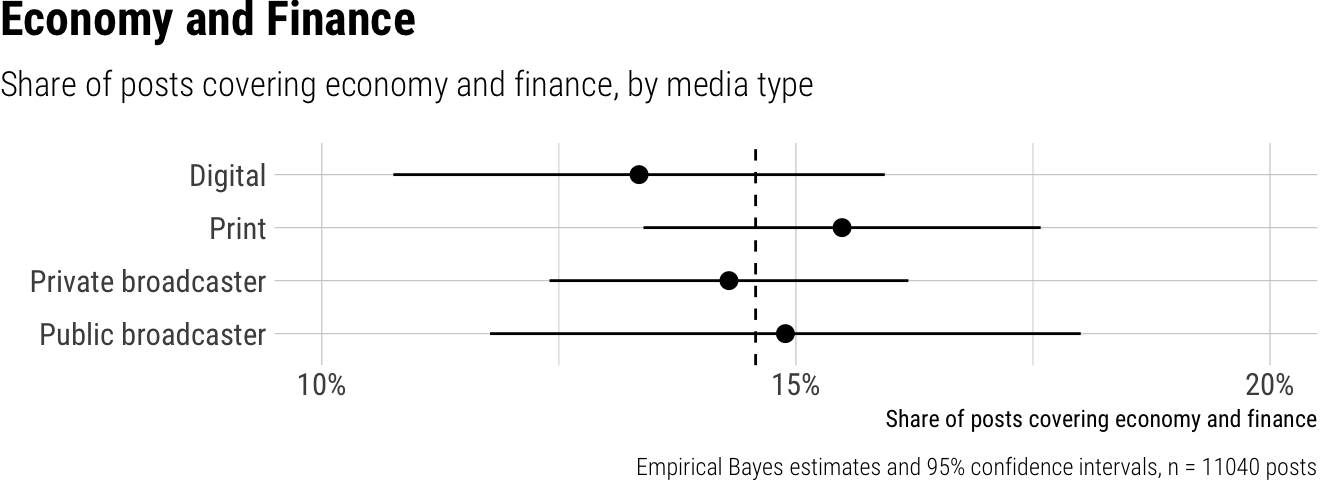
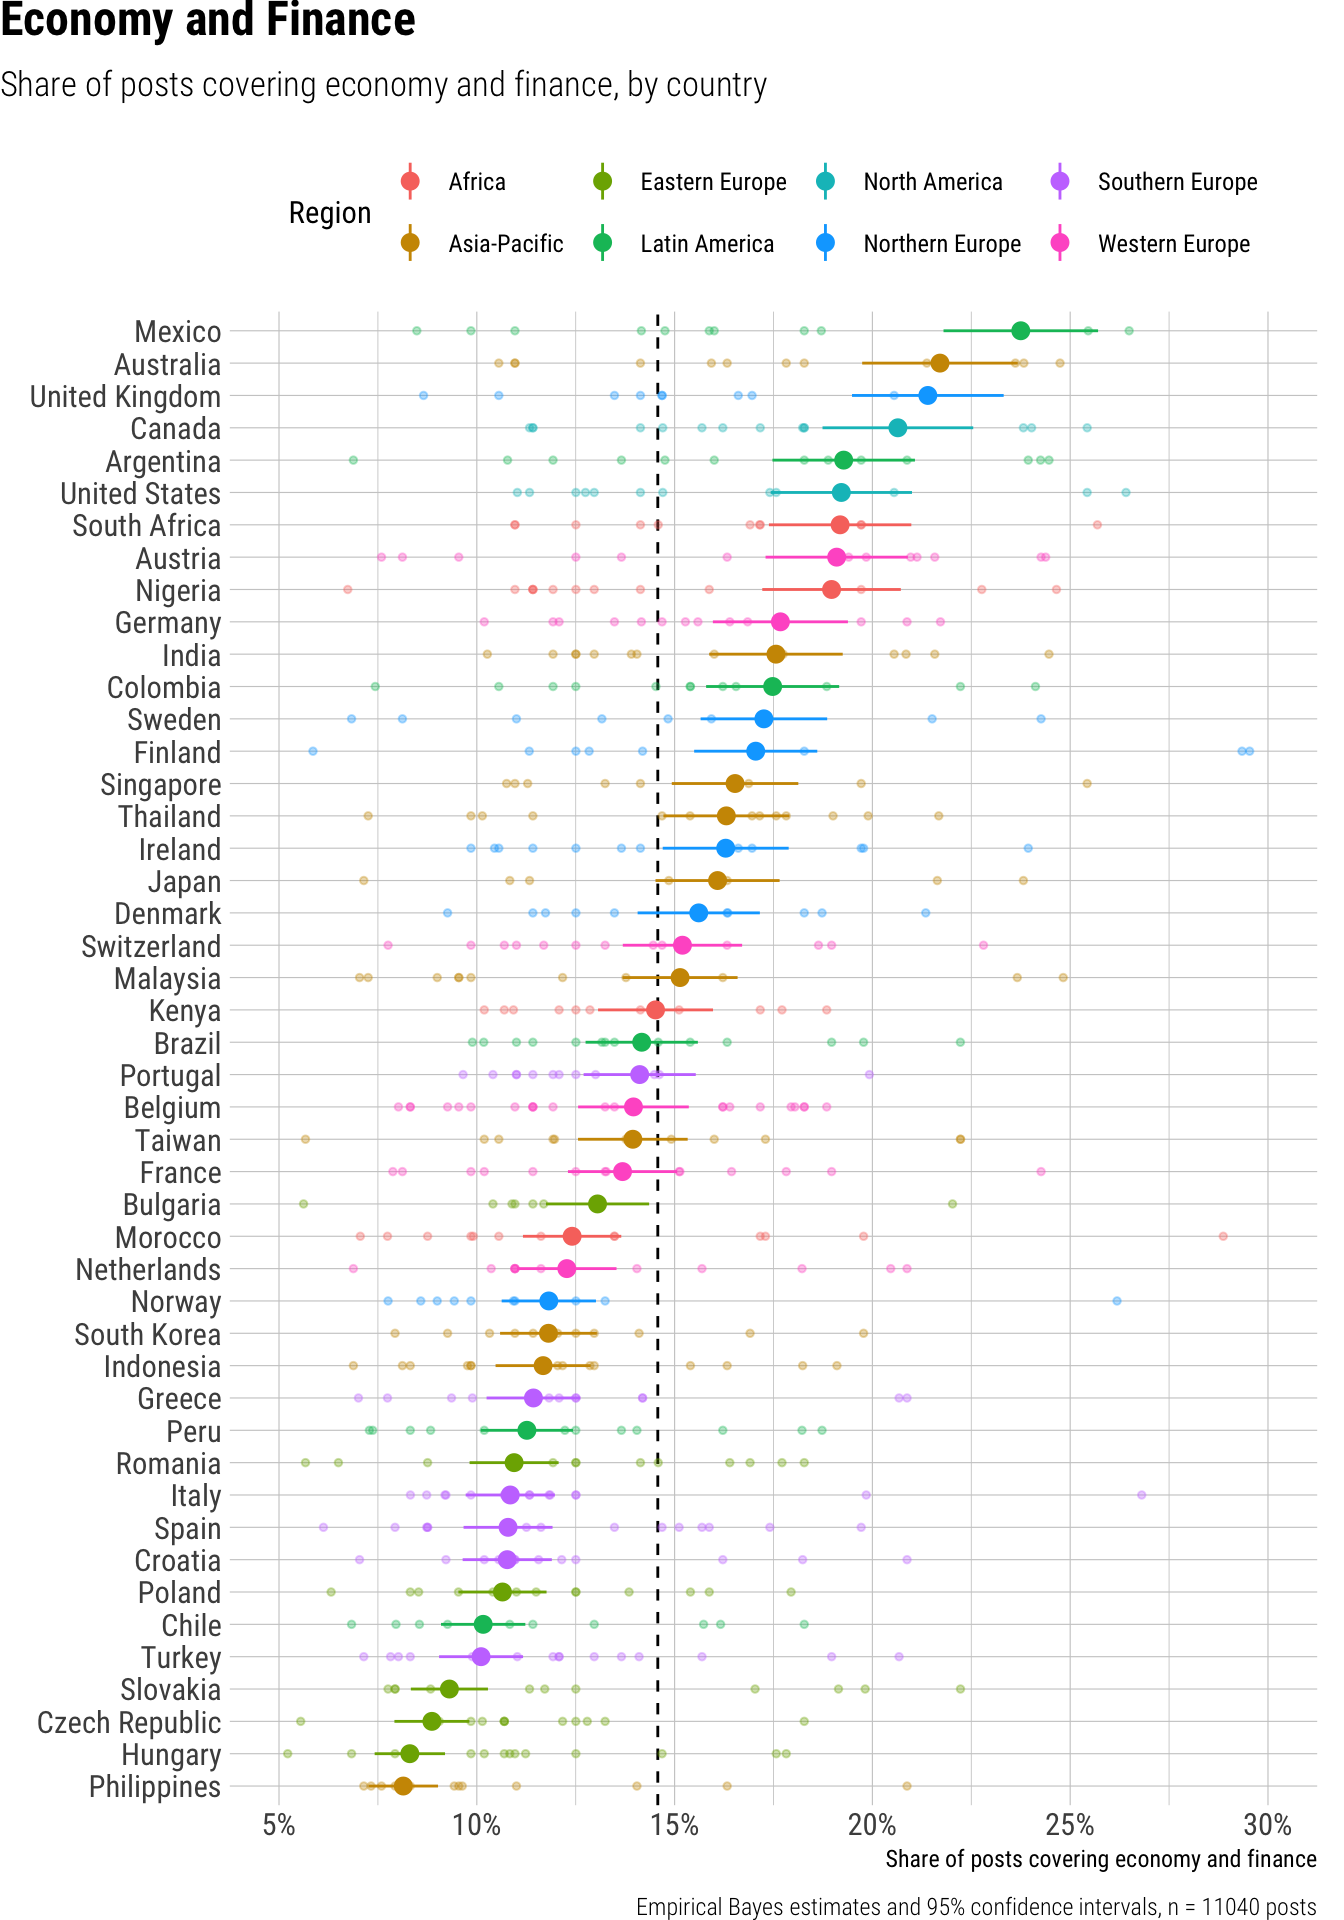
Across all platforms and news outlets, the overall average share of short video posts dedicated to economy and finance was 15%. We observed only small and non-significant differences in this share when comparing content across Instagram, TikTok, and YouTube Shorts, with all platforms hovering around the overall average. Similarly, the type of news outlet—whether digital, print, private, or public broadcaster—showed minimal and statistically non-significant variation in their focus on economic and financial topics. However, the share of economy and finance content varied substantially by country. For instance, countries like Mexico dedicated the highest proportion of their short video posts to these topics, at 24%, followed by Australia, Canada, and the United Kingdom, all around 21-22%. In contrast, countries such as Hungary and the Philippines had the lowest shares, with only 8% of their short videos covering economy and finance, alongside the Czech Republic and Slovakia at 9%.
Result tables for Topic: Economy
Overall average
| estimate | p.value | conf.low | conf.high |
|---|---|---|---|
| 0.15 | 0 | 0.13 | 0.16 |
Contrasts
| term | contrast | estimate | p.value | conf.low | conf.high |
|---|---|---|---|---|---|
| outlet_type | Print - Digital | 0.01 | 0.36 | -0.02 | 0.05 |
| outlet_type | Private broadcaster - Digital | 0.00 | 0.94 | -0.03 | 0.03 |
| outlet_type | Public broadcaster - Digital | 0.00 | 0.95 | -0.04 | 0.04 |
| platform | TikTok - Instagram | 0.01 | 0.44 | -0.01 | 0.02 |
| platform | YouTube Shorts - Instagram | 0.01 | 0.39 | -0.01 | 0.03 |
Predictions by platform
| platform | estimate | p.value | conf.low | conf.high |
|---|---|---|---|---|
| 0.14 | 0 | 0.12 | 0.16 | |
| TikTok | 0.15 | 0 | 0.13 | 0.16 |
| YouTube Shorts | 0.15 | 0 | 0.13 | 0.17 |
Predictions by outlet type
| outlet_type | estimate | p.value | conf.low | conf.high |
|---|---|---|---|---|
| Digital | 0.13 | 0 | 0.11 | 0.16 |
| 0.15 | 0 | 0.13 | 0.18 | |
| Private broadcaster | 0.14 | 0 | 0.12 | 0.16 |
| Public broadcaster | 0.15 | 0 | 0.12 | 0.18 |
Predictions by country
| country | estimate | p.value | conf.low | conf.high | region |
|---|---|---|---|---|---|
| Argentina | 0.19 | 0 | 0.17 | 0.21 | Latin America |
| Australia | 0.22 | 0 | 0.20 | 0.24 | Asia-Pacific |
| Austria | 0.19 | 0 | 0.17 | 0.21 | Western Europe |
| Belgium | 0.14 | 0 | 0.13 | 0.15 | Western Europe |
| Brazil | 0.14 | 0 | 0.13 | 0.16 | Latin America |
| Bulgaria | 0.13 | 0 | 0.12 | 0.14 | Eastern Europe |
| Canada | 0.21 | 0 | 0.19 | 0.23 | North America |
| Chile | 0.10 | 0 | 0.09 | 0.11 | Latin America |
| Colombia | 0.17 | 0 | 0.16 | 0.19 | Latin America |
| Croatia | 0.11 | 0 | 0.10 | 0.12 | Southern Europe |
| Czech Republic | 0.09 | 0 | 0.08 | 0.10 | Eastern Europe |
| Denmark | 0.16 | 0 | 0.14 | 0.17 | Northern Europe |
| Finland | 0.17 | 0 | 0.15 | 0.19 | Northern Europe |
| France | 0.14 | 0 | 0.12 | 0.15 | Western Europe |
| Germany | 0.18 | 0 | 0.16 | 0.19 | Western Europe |
| Greece | 0.11 | 0 | 0.10 | 0.13 | Southern Europe |
| Hungary | 0.08 | 0 | 0.07 | 0.09 | Eastern Europe |
| India | 0.18 | 0 | 0.16 | 0.19 | Asia-Pacific |
| Indonesia | 0.12 | 0 | 0.10 | 0.13 | Asia-Pacific |
| Ireland | 0.16 | 0 | 0.15 | 0.18 | Northern Europe |
| Italy | 0.11 | 0 | 0.10 | 0.12 | Southern Europe |
| Japan | 0.16 | 0 | 0.15 | 0.18 | Asia-Pacific |
| Kenya | 0.15 | 0 | 0.13 | 0.16 | Africa |
| Malaysia | 0.15 | 0 | 0.14 | 0.17 | Asia-Pacific |
| Mexico | 0.24 | 0 | 0.22 | 0.26 | Latin America |
| Morocco | 0.12 | 0 | 0.11 | 0.14 | Africa |
| Netherlands | 0.12 | 0 | 0.11 | 0.14 | Western Europe |
| Nigeria | 0.19 | 0 | 0.17 | 0.21 | Africa |
| Norway | 0.12 | 0 | 0.11 | 0.13 | Northern Europe |
| Peru | 0.11 | 0 | 0.10 | 0.12 | Latin America |
| Philippines | 0.08 | 0 | 0.07 | 0.09 | Asia-Pacific |
| Poland | 0.11 | 0 | 0.10 | 0.12 | Eastern Europe |
| Portugal | 0.14 | 0 | 0.13 | 0.16 | Southern Europe |
| Romania | 0.11 | 0 | 0.10 | 0.12 | Eastern Europe |
| Singapore | 0.17 | 0 | 0.15 | 0.18 | Asia-Pacific |
| Slovakia | 0.09 | 0 | 0.08 | 0.10 | Eastern Europe |
| South Africa | 0.19 | 0 | 0.17 | 0.21 | Africa |
| South Korea | 0.12 | 0 | 0.11 | 0.13 | Asia-Pacific |
| Spain | 0.11 | 0 | 0.10 | 0.12 | Southern Europe |
| Sweden | 0.17 | 0 | 0.16 | 0.19 | Northern Europe |
| Switzerland | 0.15 | 0 | 0.14 | 0.17 | Western Europe |
| Taiwan | 0.14 | 0 | 0.13 | 0.15 | Asia-Pacific |
| Thailand | 0.16 | 0 | 0.15 | 0.18 | Asia-Pacific |
| Turkey | 0.10 | 0 | 0.09 | 0.11 | Southern Europe |
| United Kingdom | 0.21 | 0 | 0.19 | 0.23 | Northern Europe |
| United States | 0.19 | 0 | 0.17 | 0.21 | North America |
Health and Fitness
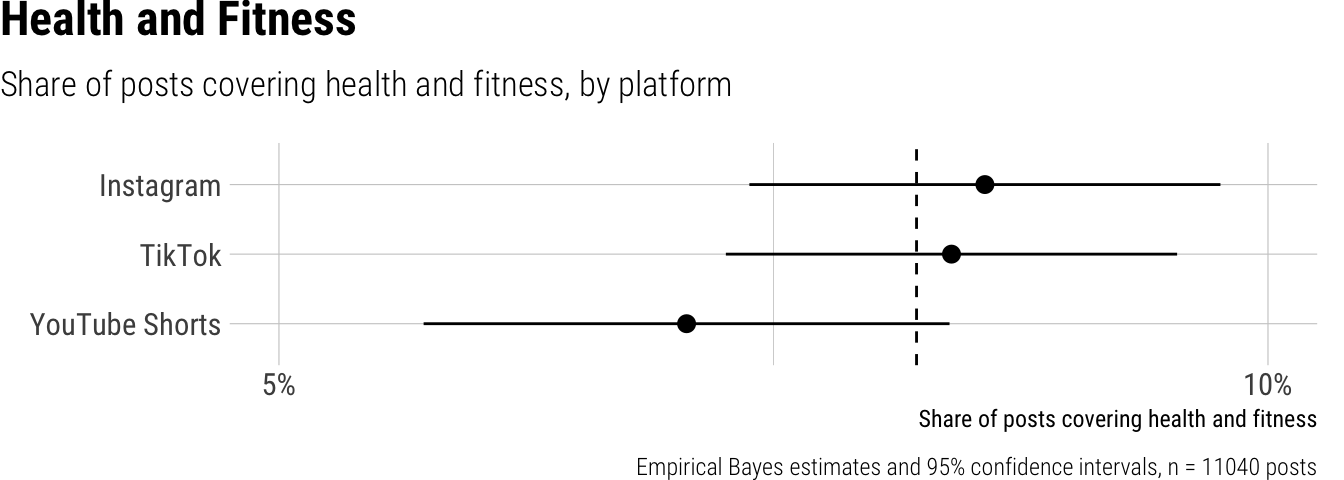
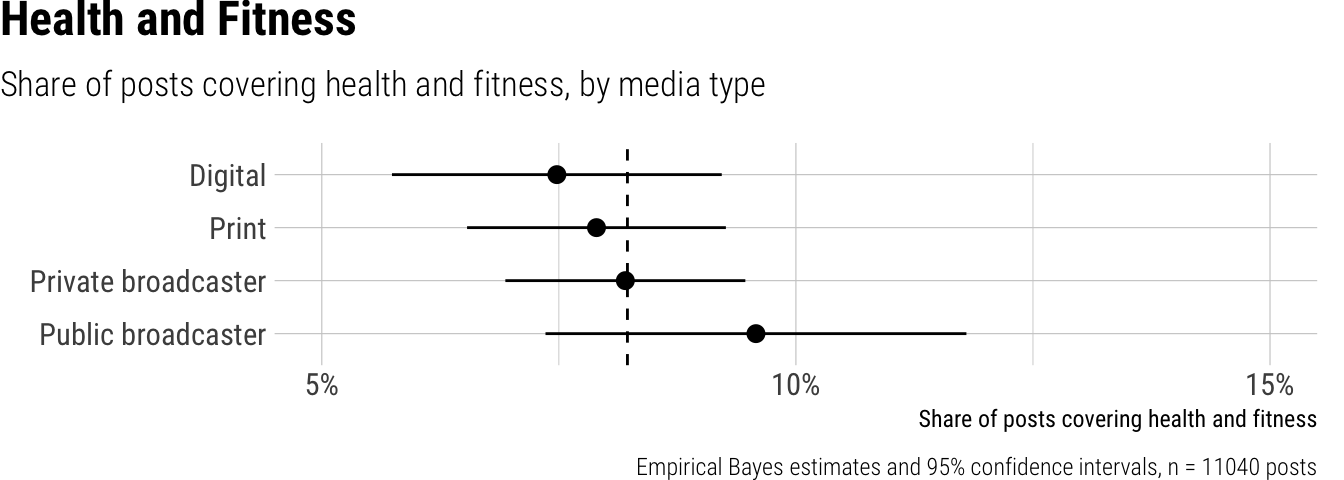
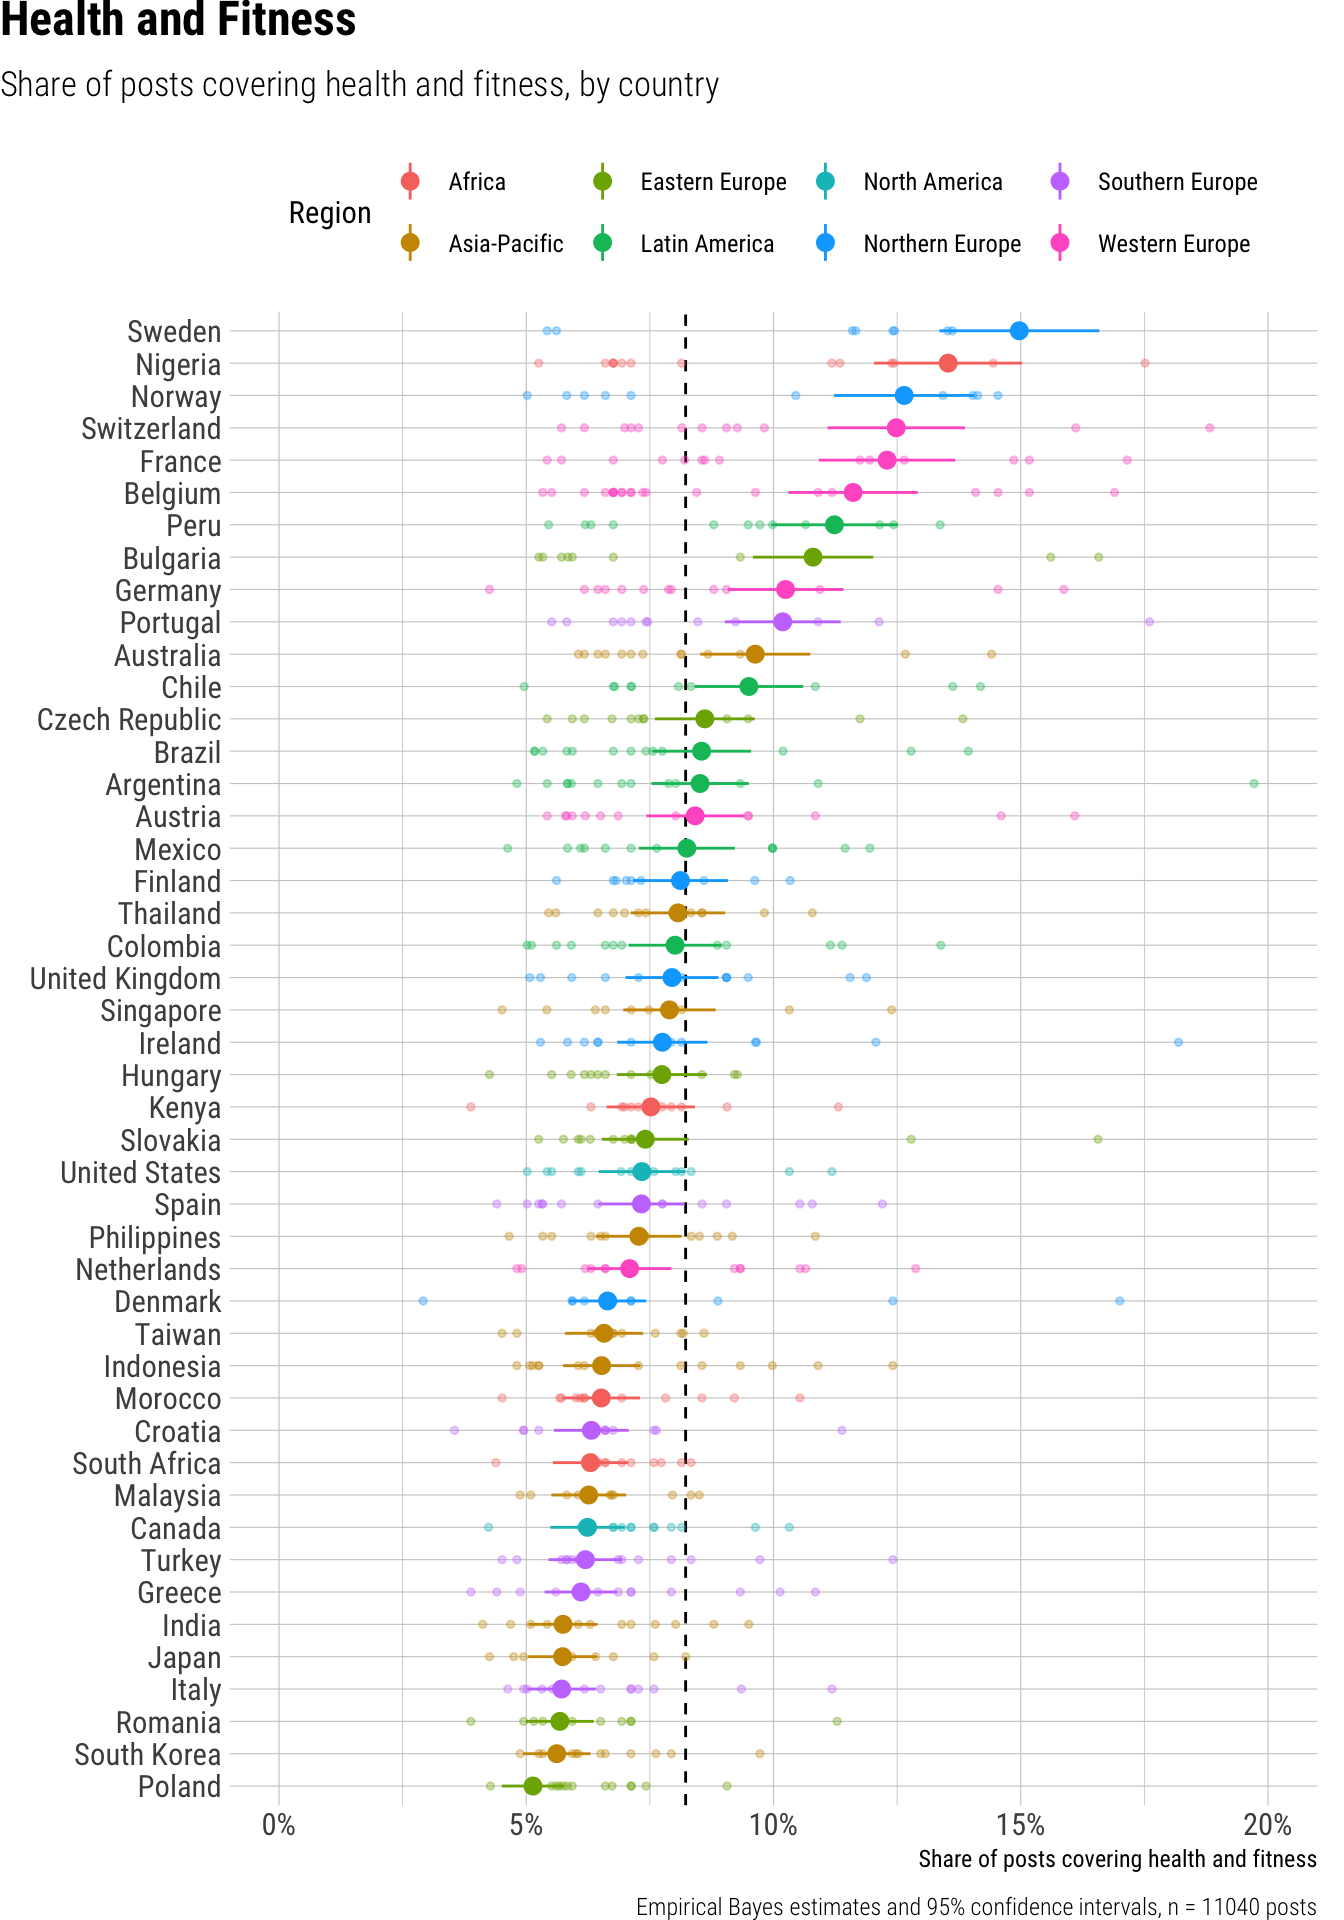
Overall, 8% of short video posts from news outlets covered health and fitness. When examining platforms, Instagram posts dedicated a slightly larger share to these topics at 9%, compared to TikTok at 8%, and YouTube Shorts at 7%. Differences were also observed across outlet types, with public broadcasters dedicating 10% of their posts to health and fitness, which was a higher share than digital outlets (7%), print outlets (8%), and private broadcasters (8%). Significant variations emerged among countries, ranging from as low as 5% in Poland to as high as 15% in Sweden, with other high shares seen in Nigeria (14%) and Norway (13%).
Result tables for Topic: Health
Overall average
| estimate | p.value | conf.low | conf.high |
|---|---|---|---|
| 0.08 | 0 | 0.07 | 0.09 |
Contrasts
| term | contrast | estimate | p.value | conf.low | conf.high |
|---|---|---|---|---|---|
| outlet_type | Print - Digital | 0.00 | 0.81 | -0.02 | 0.02 |
| outlet_type | Private broadcaster - Digital | 0.01 | 0.47 | -0.01 | 0.03 |
| outlet_type | Public broadcaster - Digital | 0.02 | 0.10 | 0.00 | 0.05 |
| platform | TikTok - Instagram | 0.00 | 0.87 | -0.01 | 0.01 |
| platform | YouTube Shorts - Instagram | -0.01 | 0.16 | -0.03 | 0.00 |
Predictions by platform
| platform | estimate | p.value | conf.low | conf.high |
|---|---|---|---|---|
| 0.09 | 0 | 0.07 | 0.10 | |
| TikTok | 0.08 | 0 | 0.07 | 0.10 |
| YouTube Shorts | 0.07 | 0 | 0.06 | 0.08 |
Predictions by outlet type
| outlet_type | estimate | p.value | conf.low | conf.high |
|---|---|---|---|---|
| Digital | 0.07 | 0 | 0.06 | 0.09 |
| 0.08 | 0 | 0.07 | 0.09 | |
| Private broadcaster | 0.08 | 0 | 0.07 | 0.09 |
| Public broadcaster | 0.10 | 0 | 0.07 | 0.12 |
Predictions by country
| country | estimate | p.value | conf.low | conf.high | region |
|---|---|---|---|---|---|
| Argentina | 0.09 | 0 | 0.08 | 0.09 | Latin America |
| Australia | 0.10 | 0 | 0.09 | 0.11 | Asia-Pacific |
| Austria | 0.08 | 0 | 0.07 | 0.09 | Western Europe |
| Belgium | 0.12 | 0 | 0.10 | 0.13 | Western Europe |
| Brazil | 0.09 | 0 | 0.08 | 0.10 | Latin America |
| Bulgaria | 0.11 | 0 | 0.10 | 0.12 | Eastern Europe |
| Canada | 0.06 | 0 | 0.05 | 0.07 | North America |
| Chile | 0.10 | 0 | 0.08 | 0.11 | Latin America |
| Colombia | 0.08 | 0 | 0.07 | 0.09 | Latin America |
| Croatia | 0.06 | 0 | 0.06 | 0.07 | Southern Europe |
| Czech Republic | 0.09 | 0 | 0.08 | 0.10 | Eastern Europe |
| Denmark | 0.07 | 0 | 0.06 | 0.07 | Northern Europe |
| Finland | 0.08 | 0 | 0.07 | 0.09 | Northern Europe |
| France | 0.12 | 0 | 0.11 | 0.14 | Western Europe |
| Germany | 0.10 | 0 | 0.09 | 0.11 | Western Europe |
| Greece | 0.06 | 0 | 0.05 | 0.07 | Southern Europe |
| Hungary | 0.08 | 0 | 0.07 | 0.09 | Eastern Europe |
| India | 0.06 | 0 | 0.05 | 0.06 | Asia-Pacific |
| Indonesia | 0.07 | 0 | 0.06 | 0.07 | Asia-Pacific |
| Ireland | 0.08 | 0 | 0.07 | 0.09 | Northern Europe |
| Italy | 0.06 | 0 | 0.05 | 0.06 | Southern Europe |
| Japan | 0.06 | 0 | 0.05 | 0.06 | Asia-Pacific |
| Kenya | 0.08 | 0 | 0.07 | 0.08 | Africa |
| Malaysia | 0.06 | 0 | 0.06 | 0.07 | Asia-Pacific |
| Mexico | 0.08 | 0 | 0.07 | 0.09 | Latin America |
| Morocco | 0.07 | 0 | 0.06 | 0.07 | Africa |
| Netherlands | 0.07 | 0 | 0.06 | 0.08 | Western Europe |
| Nigeria | 0.14 | 0 | 0.12 | 0.15 | Africa |
| Norway | 0.13 | 0 | 0.11 | 0.14 | Northern Europe |
| Peru | 0.11 | 0 | 0.10 | 0.13 | Latin America |
| Philippines | 0.07 | 0 | 0.06 | 0.08 | Asia-Pacific |
| Poland | 0.05 | 0 | 0.05 | 0.06 | Eastern Europe |
| Portugal | 0.10 | 0 | 0.09 | 0.11 | Southern Europe |
| Romania | 0.06 | 0 | 0.05 | 0.06 | Eastern Europe |
| Singapore | 0.08 | 0 | 0.07 | 0.09 | Asia-Pacific |
| Slovakia | 0.07 | 0 | 0.07 | 0.08 | Eastern Europe |
| South Africa | 0.06 | 0 | 0.06 | 0.07 | Africa |
| South Korea | 0.06 | 0 | 0.05 | 0.06 | Asia-Pacific |
| Spain | 0.07 | 0 | 0.06 | 0.08 | Southern Europe |
| Sweden | 0.15 | 0 | 0.13 | 0.17 | Northern Europe |
| Switzerland | 0.12 | 0 | 0.11 | 0.14 | Western Europe |
| Taiwan | 0.07 | 0 | 0.06 | 0.07 | Asia-Pacific |
| Thailand | 0.08 | 0 | 0.07 | 0.09 | Asia-Pacific |
| Turkey | 0.06 | 0 | 0.05 | 0.07 | Southern Europe |
| United Kingdom | 0.08 | 0 | 0.07 | 0.09 | Northern Europe |
| United States | 0.07 | 0 | 0.06 | 0.08 | North America |
Mobility and Infrastructure
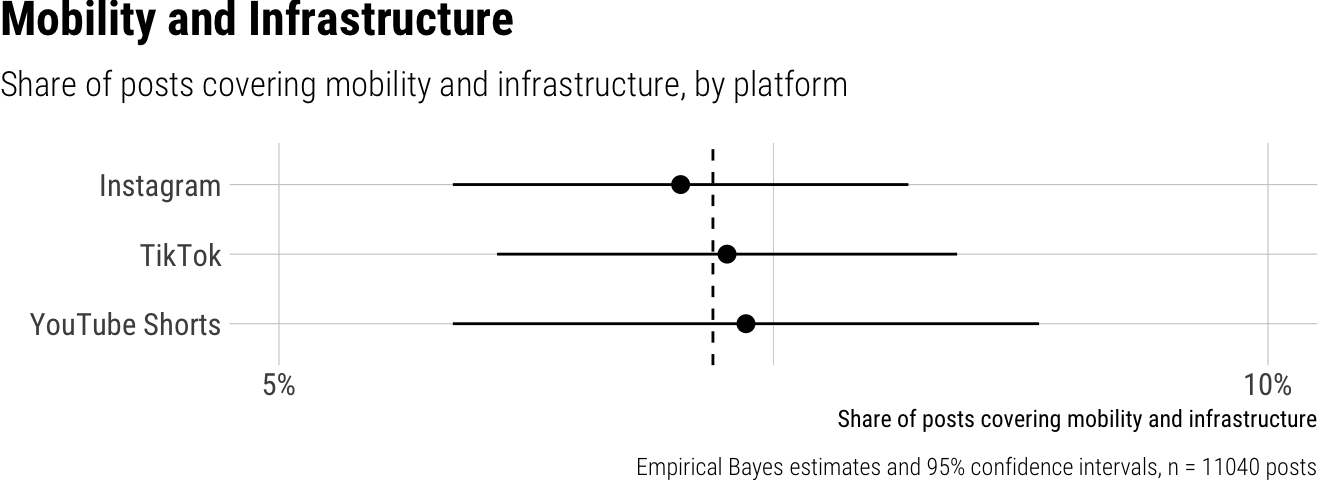
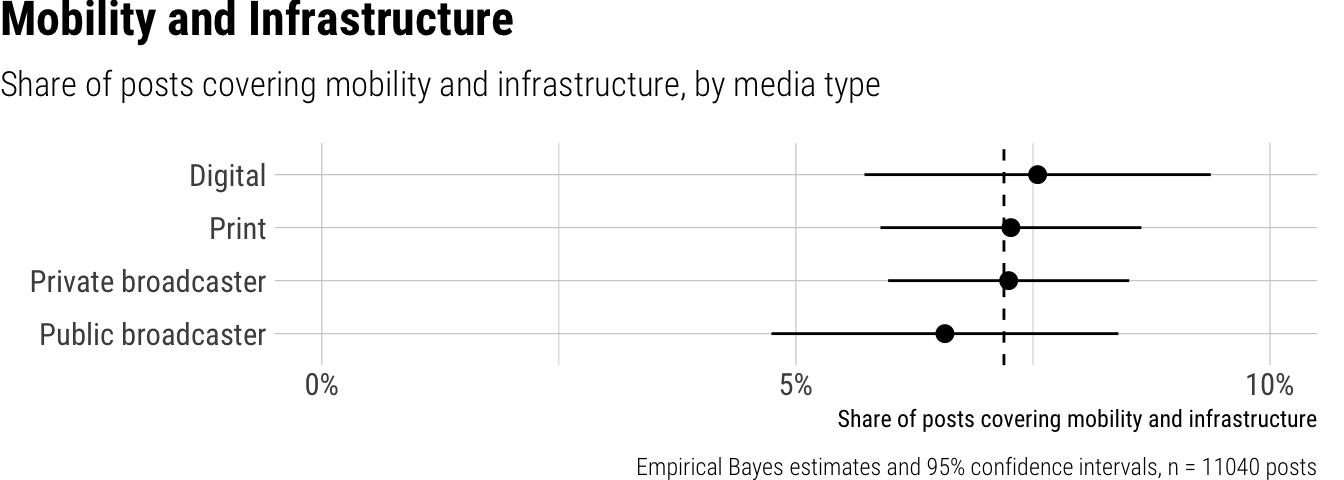
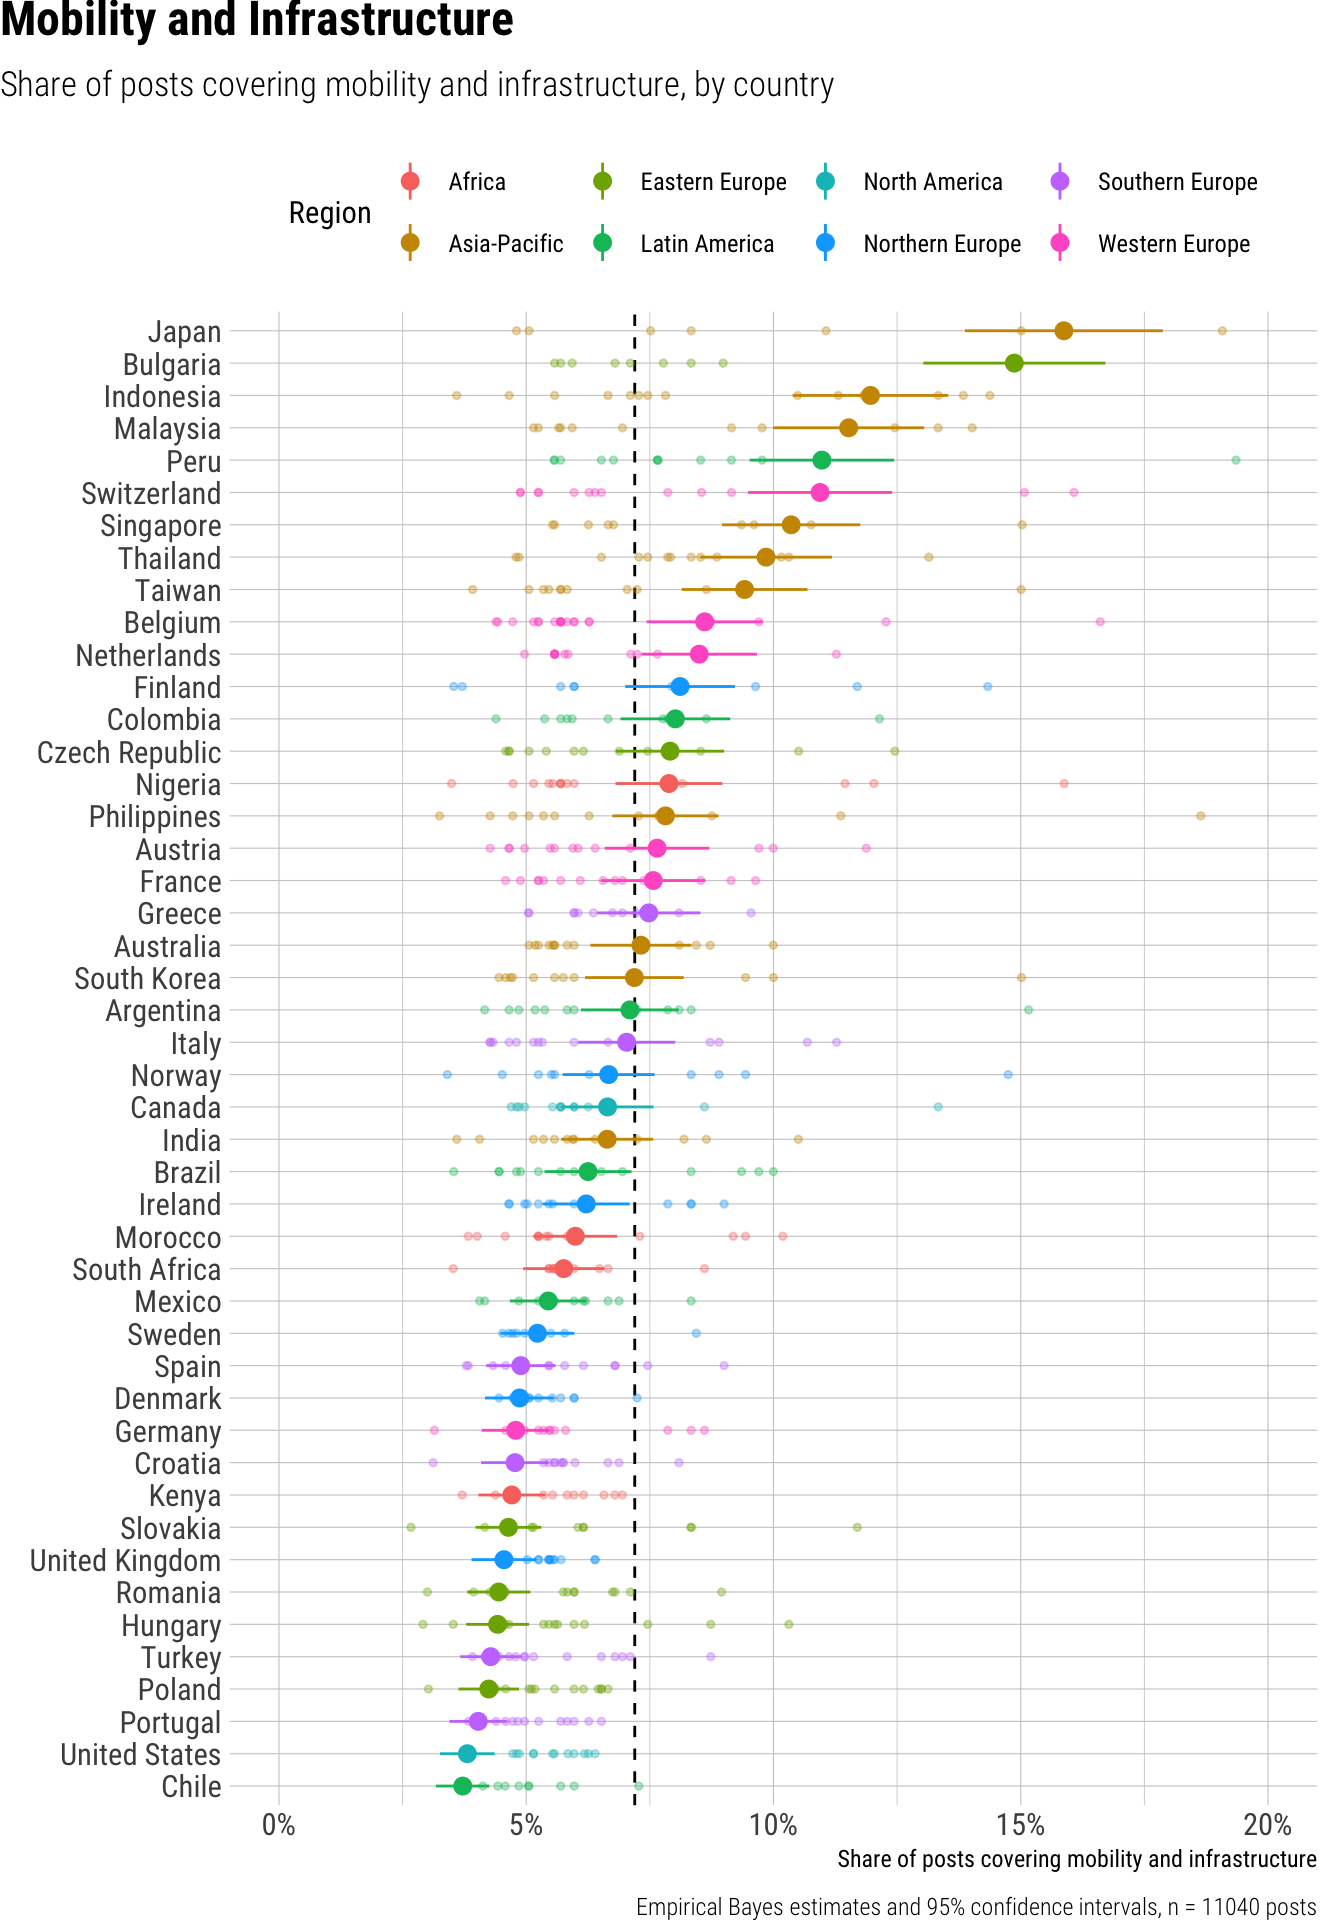
Across all news outlets and platforms, the analysis revealed that 7% of short video posts covered mobility and infrastructure. We observed no statistically significant or substantially meaningful differences in this content share across various social media platforms, including Instagram, TikTok, and YouTube Shorts, where the share consistently remained around 7%. Similarly, outlet types—digital, print, private broadcasters, and public broadcasters—showed only minor and non-significant variations, with digital outlets posting slightly more at 8% compared to 7% for the others. However, significant variations emerged when examining content by country. News outlets in Japan dedicated the highest proportion of their short video posts to mobility and infrastructure at 16%, followed closely by Bulgaria at 15%, and Indonesia and Malaysia both at 12%. In contrast, countries such as Chile, Hungary, Poland, Portugal, Romania, Turkey, and the United States featured mobility and infrastructure content least often, with only 4% of their short video posts focusing on these topics.
Result tables for Topic: Mobility
Overall average
| estimate | p.value | conf.low | conf.high |
|---|---|---|---|
| 0.07 | 0 | 0.06 | 0.08 |
Contrasts
| term | contrast | estimate | p.value | conf.low | conf.high |
|---|---|---|---|---|---|
| outlet_type | Print - Digital | 0.00 | 0.93 | -0.02 | 0.02 |
| outlet_type | Private broadcaster - Digital | -0.01 | 0.48 | -0.03 | 0.01 |
| outlet_type | Public broadcaster - Digital | -0.01 | 0.29 | -0.04 | 0.01 |
| platform | TikTok - Instagram | 0.00 | 0.55 | -0.01 | 0.01 |
| platform | YouTube Shorts - Instagram | 0.00 | 0.61 | -0.02 | 0.01 |
Predictions by platform
| platform | estimate | p.value | conf.low | conf.high |
|---|---|---|---|---|
| 0.07 | 0 | 0.06 | 0.08 | |
| TikTok | 0.07 | 0 | 0.06 | 0.08 |
| YouTube Shorts | 0.07 | 0 | 0.06 | 0.09 |
Predictions by outlet type
| outlet_type | estimate | p.value | conf.low | conf.high |
|---|---|---|---|---|
| Digital | 0.08 | 0 | 0.06 | 0.09 |
| 0.07 | 0 | 0.06 | 0.09 | |
| Private broadcaster | 0.07 | 0 | 0.06 | 0.09 |
| Public broadcaster | 0.07 | 0 | 0.05 | 0.08 |
Predictions by country
| country | estimate | p.value | conf.low | conf.high | region |
|---|---|---|---|---|---|
| Argentina | 0.07 | 0 | 0.06 | 0.08 | Latin America |
| Australia | 0.07 | 0 | 0.06 | 0.08 | Asia-Pacific |
| Austria | 0.08 | 0 | 0.07 | 0.09 | Western Europe |
| Belgium | 0.09 | 0 | 0.07 | 0.10 | Western Europe |
| Brazil | 0.06 | 0 | 0.05 | 0.07 | Latin America |
| Bulgaria | 0.15 | 0 | 0.13 | 0.17 | Eastern Europe |
| Canada | 0.07 | 0 | 0.06 | 0.08 | North America |
| Chile | 0.04 | 0 | 0.03 | 0.04 | Latin America |
| Colombia | 0.08 | 0 | 0.07 | 0.09 | Latin America |
| Croatia | 0.05 | 0 | 0.04 | 0.05 | Southern Europe |
| Czech Republic | 0.08 | 0 | 0.07 | 0.09 | Eastern Europe |
| Denmark | 0.05 | 0 | 0.04 | 0.06 | Northern Europe |
| Finland | 0.08 | 0 | 0.07 | 0.09 | Northern Europe |
| France | 0.08 | 0 | 0.07 | 0.09 | Western Europe |
| Germany | 0.05 | 0 | 0.04 | 0.05 | Western Europe |
| Greece | 0.07 | 0 | 0.06 | 0.09 | Southern Europe |
| Hungary | 0.04 | 0 | 0.04 | 0.05 | Eastern Europe |
| India | 0.07 | 0 | 0.06 | 0.08 | Asia-Pacific |
| Indonesia | 0.12 | 0 | 0.10 | 0.14 | Asia-Pacific |
| Ireland | 0.06 | 0 | 0.05 | 0.07 | Northern Europe |
| Italy | 0.07 | 0 | 0.06 | 0.08 | Southern Europe |
| Japan | 0.16 | 0 | 0.14 | 0.18 | Asia-Pacific |
| Kenya | 0.05 | 0 | 0.04 | 0.05 | Africa |
| Malaysia | 0.12 | 0 | 0.10 | 0.13 | Asia-Pacific |
| Mexico | 0.05 | 0 | 0.05 | 0.06 | Latin America |
| Morocco | 0.06 | 0 | 0.05 | 0.07 | Africa |
| Netherlands | 0.08 | 0 | 0.07 | 0.10 | Western Europe |
| Nigeria | 0.08 | 0 | 0.07 | 0.09 | Africa |
| Norway | 0.07 | 0 | 0.06 | 0.08 | Northern Europe |
| Peru | 0.11 | 0 | 0.10 | 0.12 | Latin America |
| Philippines | 0.08 | 0 | 0.07 | 0.09 | Asia-Pacific |
| Poland | 0.04 | 0 | 0.04 | 0.05 | Eastern Europe |
| Portugal | 0.04 | 0 | 0.03 | 0.05 | Southern Europe |
| Romania | 0.04 | 0 | 0.04 | 0.05 | Eastern Europe |
| Singapore | 0.10 | 0 | 0.09 | 0.12 | Asia-Pacific |
| Slovakia | 0.05 | 0 | 0.04 | 0.05 | Eastern Europe |
| South Africa | 0.06 | 0 | 0.05 | 0.07 | Africa |
| South Korea | 0.07 | 0 | 0.06 | 0.08 | Asia-Pacific |
| Spain | 0.05 | 0 | 0.04 | 0.06 | Southern Europe |
| Sweden | 0.05 | 0 | 0.04 | 0.06 | Northern Europe |
| Switzerland | 0.11 | 0 | 0.09 | 0.12 | Western Europe |
| Taiwan | 0.09 | 0 | 0.08 | 0.11 | Asia-Pacific |
| Thailand | 0.10 | 0 | 0.09 | 0.11 | Asia-Pacific |
| Turkey | 0.04 | 0 | 0.04 | 0.05 | Southern Europe |
| United Kingdom | 0.05 | 0 | 0.04 | 0.05 | Northern Europe |
| United States | 0.04 | 0 | 0.03 | 0.04 | North America |
Environment and Energy
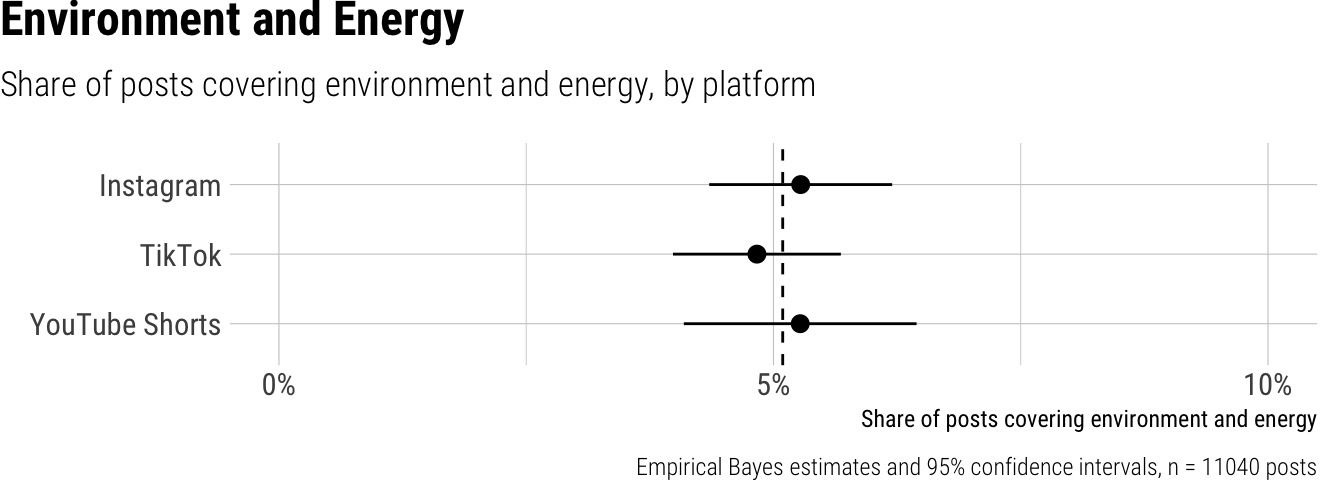
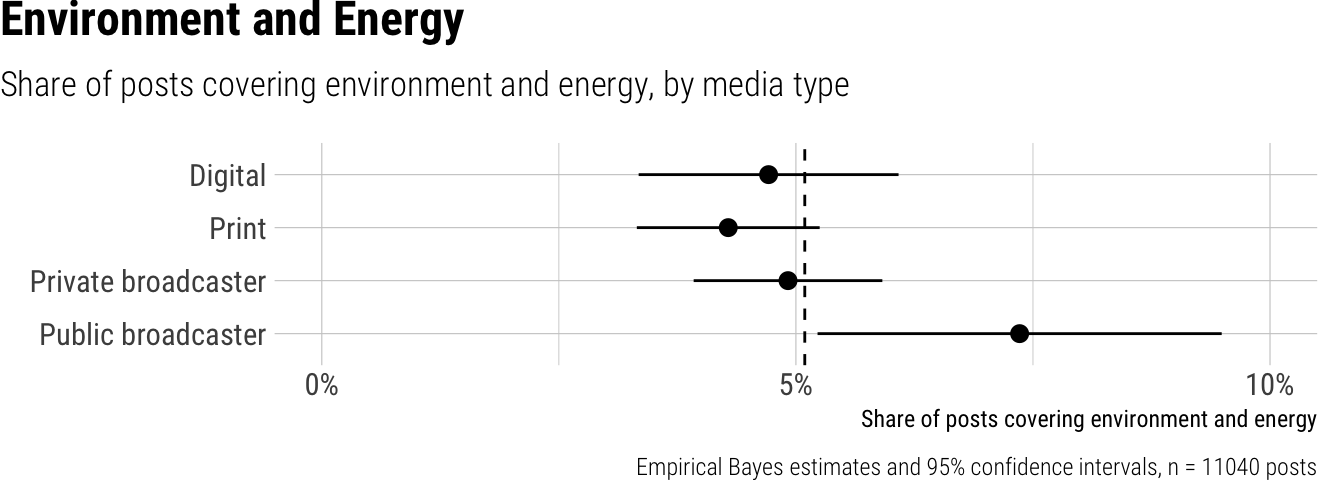
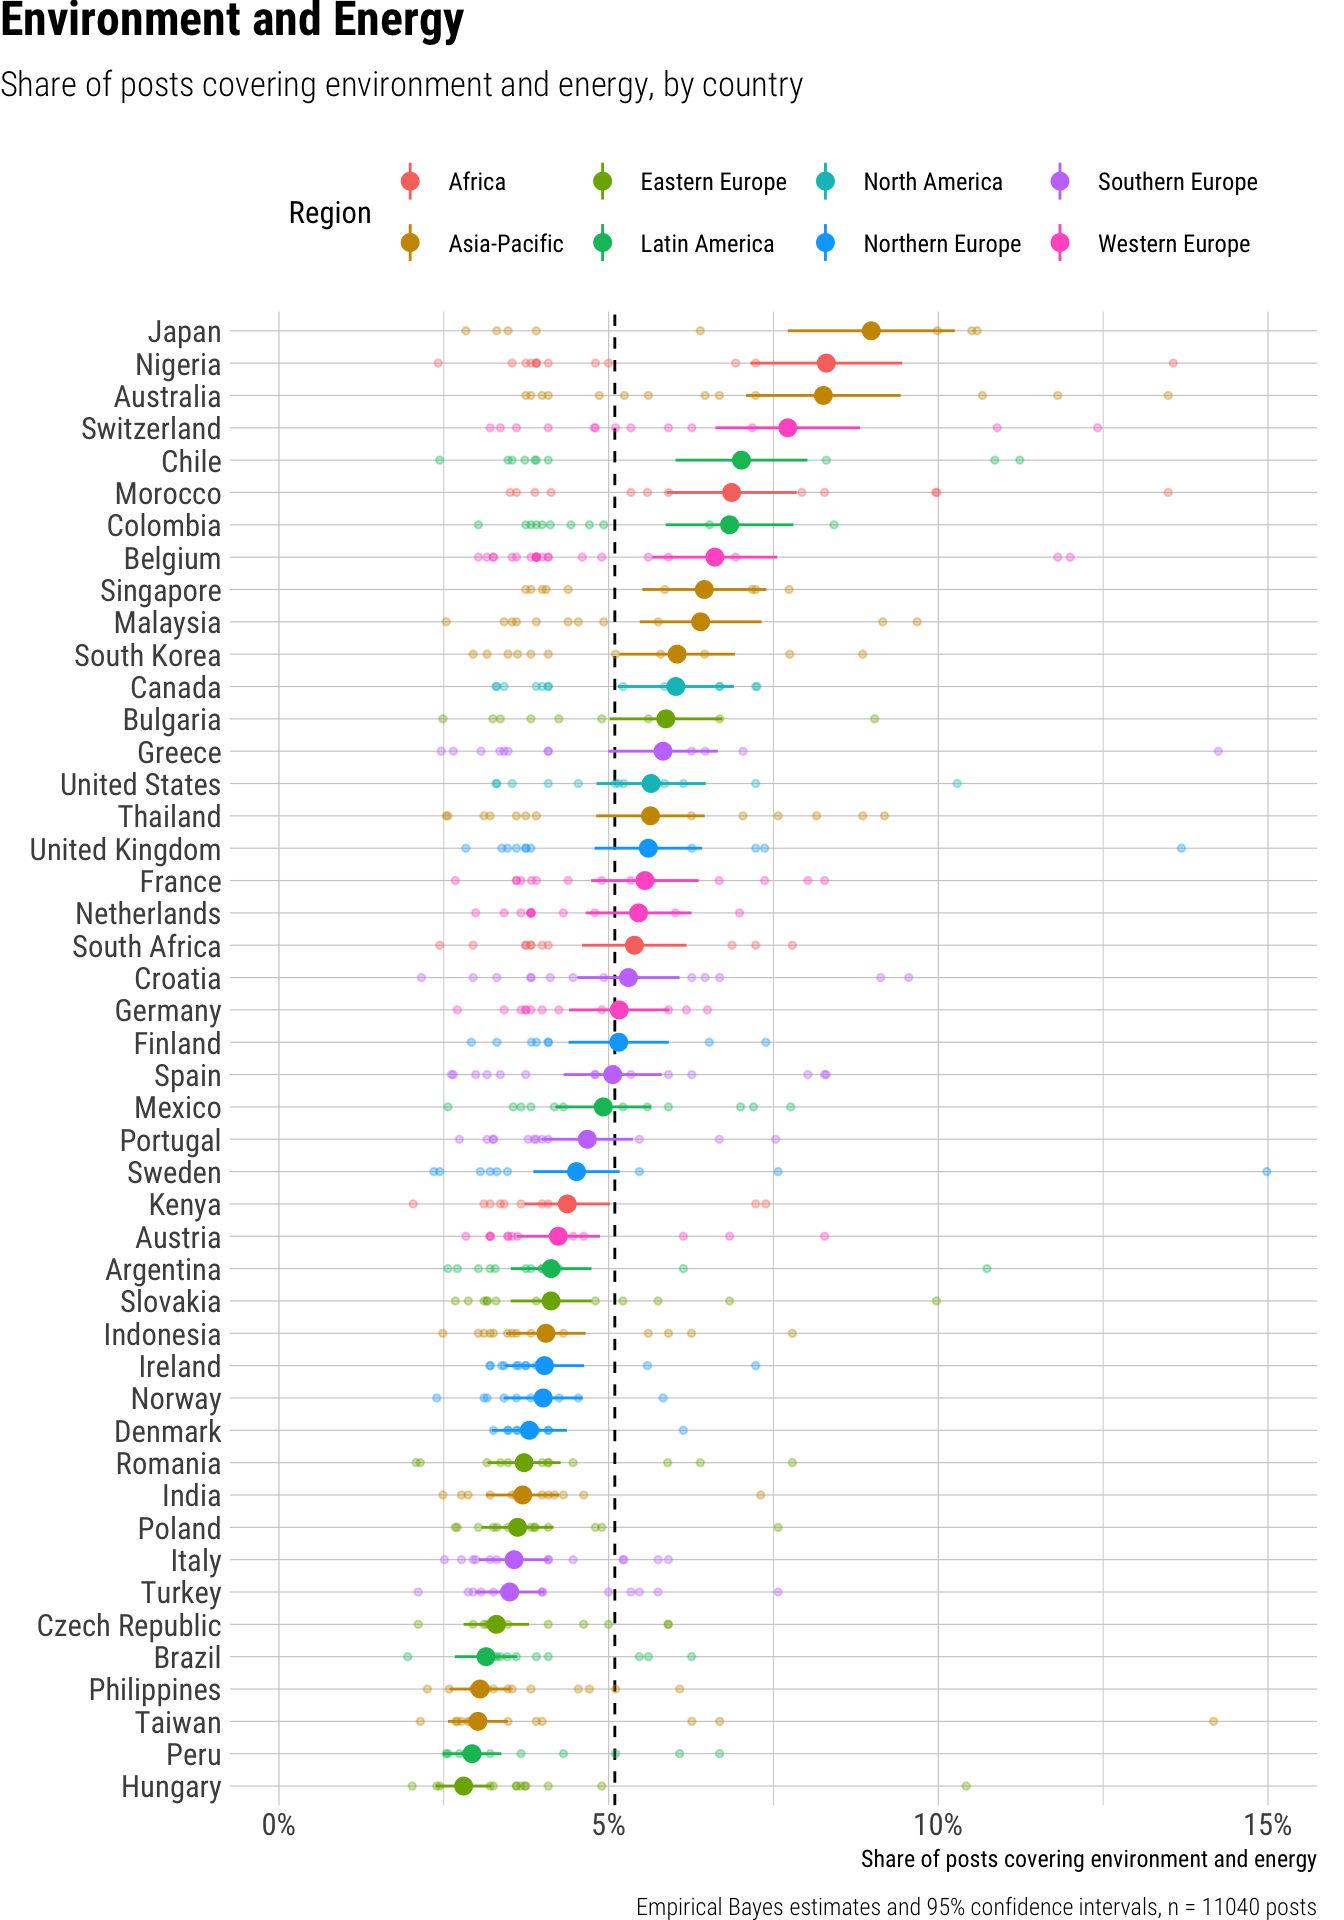
Overall, the analysis showed that environment and energy topics made up an average of 5% of short video posts published by news outlets. This share remained consistent across platforms, with no statistically significant differences found between Instagram, TikTok, and YouTube Shorts. However, variations appeared when considering outlet types; public broadcasters allocated a notably higher proportion of their short video content to environment and energy themes, at 7% of their posts, while digital and private broadcasters featured these topics in 5% of their posts, and print outlets in 4%. We also observed considerable country-level differences, with the share of environment and energy content ranging from a low of 3% in countries such as Brazil, Czech Republic, Hungary, Peru, Philippines, Taiwan, and Turkey, to a high of 9% in Japan, and 8% in Australia, Nigeria, and Switzerland.
Result tables for Topic: Environment
Overall average
| estimate | p.value | conf.low | conf.high |
|---|---|---|---|
| 0.05 | 0 | 0.04 | 0.06 |
Contrasts
| term | contrast | estimate | p.value | conf.low | conf.high |
|---|---|---|---|---|---|
| outlet_type | Print - Digital | 0.00 | 0.56 | -0.02 | 0.01 |
| outlet_type | Private broadcaster - Digital | 0.00 | 0.69 | -0.02 | 0.01 |
| outlet_type | Public broadcaster - Digital | 0.02 | 0.09 | 0.00 | 0.05 |
| platform | TikTok - Instagram | -0.01 | 0.26 | -0.01 | 0.00 |
| platform | YouTube Shorts - Instagram | 0.00 | 0.88 | -0.01 | 0.01 |
Predictions by platform
| platform | estimate | p.value | conf.low | conf.high |
|---|---|---|---|---|
| 0.05 | 0 | 0.04 | 0.06 | |
| TikTok | 0.05 | 0 | 0.04 | 0.06 |
| YouTube Shorts | 0.05 | 0 | 0.04 | 0.06 |
Predictions by outlet type
| outlet_type | estimate | p.value | conf.low | conf.high |
|---|---|---|---|---|
| Digital | 0.05 | 0 | 0.03 | 0.06 |
| 0.04 | 0 | 0.03 | 0.05 | |
| Private broadcaster | 0.05 | 0 | 0.04 | 0.06 |
| Public broadcaster | 0.07 | 0 | 0.05 | 0.09 |
Predictions by country
| country | estimate | p.value | conf.low | conf.high | region |
|---|---|---|---|---|---|
| Argentina | 0.04 | 0 | 0.04 | 0.05 | Latin America |
| Australia | 0.08 | 0 | 0.07 | 0.09 | Asia-Pacific |
| Austria | 0.04 | 0 | 0.04 | 0.05 | Western Europe |
| Belgium | 0.07 | 0 | 0.06 | 0.08 | Western Europe |
| Brazil | 0.03 | 0 | 0.03 | 0.04 | Latin America |
| Bulgaria | 0.06 | 0 | 0.05 | 0.07 | Eastern Europe |
| Canada | 0.06 | 0 | 0.05 | 0.07 | North America |
| Chile | 0.07 | 0 | 0.06 | 0.08 | Latin America |
| Colombia | 0.07 | 0 | 0.06 | 0.08 | Latin America |
| Croatia | 0.05 | 0 | 0.05 | 0.06 | Southern Europe |
| Czech Republic | 0.03 | 0 | 0.03 | 0.04 | Eastern Europe |
| Denmark | 0.04 | 0 | 0.03 | 0.04 | Northern Europe |
| Finland | 0.05 | 0 | 0.04 | 0.06 | Northern Europe |
| France | 0.06 | 0 | 0.05 | 0.06 | Western Europe |
| Germany | 0.05 | 0 | 0.04 | 0.06 | Western Europe |
| Greece | 0.06 | 0 | 0.05 | 0.07 | Southern Europe |
| Hungary | 0.03 | 0 | 0.02 | 0.03 | Eastern Europe |
| India | 0.04 | 0 | 0.03 | 0.04 | Asia-Pacific |
| Indonesia | 0.04 | 0 | 0.03 | 0.05 | Asia-Pacific |
| Ireland | 0.04 | 0 | 0.03 | 0.05 | Northern Europe |
| Italy | 0.04 | 0 | 0.03 | 0.04 | Southern Europe |
| Japan | 0.09 | 0 | 0.08 | 0.10 | Asia-Pacific |
| Kenya | 0.04 | 0 | 0.04 | 0.05 | Africa |
| Malaysia | 0.06 | 0 | 0.05 | 0.07 | Asia-Pacific |
| Mexico | 0.05 | 0 | 0.04 | 0.06 | Latin America |
| Morocco | 0.07 | 0 | 0.06 | 0.08 | Africa |
| Netherlands | 0.05 | 0 | 0.05 | 0.06 | Western Europe |
| Nigeria | 0.08 | 0 | 0.07 | 0.09 | Africa |
| Norway | 0.04 | 0 | 0.03 | 0.05 | Northern Europe |
| Peru | 0.03 | 0 | 0.02 | 0.03 | Latin America |
| Philippines | 0.03 | 0 | 0.03 | 0.04 | Asia-Pacific |
| Poland | 0.04 | 0 | 0.03 | 0.04 | Eastern Europe |
| Portugal | 0.05 | 0 | 0.04 | 0.05 | Southern Europe |
| Romania | 0.04 | 0 | 0.03 | 0.04 | Eastern Europe |
| Singapore | 0.06 | 0 | 0.06 | 0.07 | Asia-Pacific |
| Slovakia | 0.04 | 0 | 0.04 | 0.05 | Eastern Europe |
| South Africa | 0.05 | 0 | 0.05 | 0.06 | Africa |
| South Korea | 0.06 | 0 | 0.05 | 0.07 | Asia-Pacific |
| Spain | 0.05 | 0 | 0.04 | 0.06 | Southern Europe |
| Sweden | 0.05 | 0 | 0.04 | 0.05 | Northern Europe |
| Switzerland | 0.08 | 0 | 0.07 | 0.09 | Western Europe |
| Taiwan | 0.03 | 0 | 0.03 | 0.03 | Asia-Pacific |
| Thailand | 0.06 | 0 | 0.05 | 0.06 | Asia-Pacific |
| Turkey | 0.03 | 0 | 0.03 | 0.04 | Southern Europe |
| United Kingdom | 0.06 | 0 | 0.05 | 0.06 | Northern Europe |
| United States | 0.06 | 0 | 0.05 | 0.06 | North America |
Science, Technology, and Education
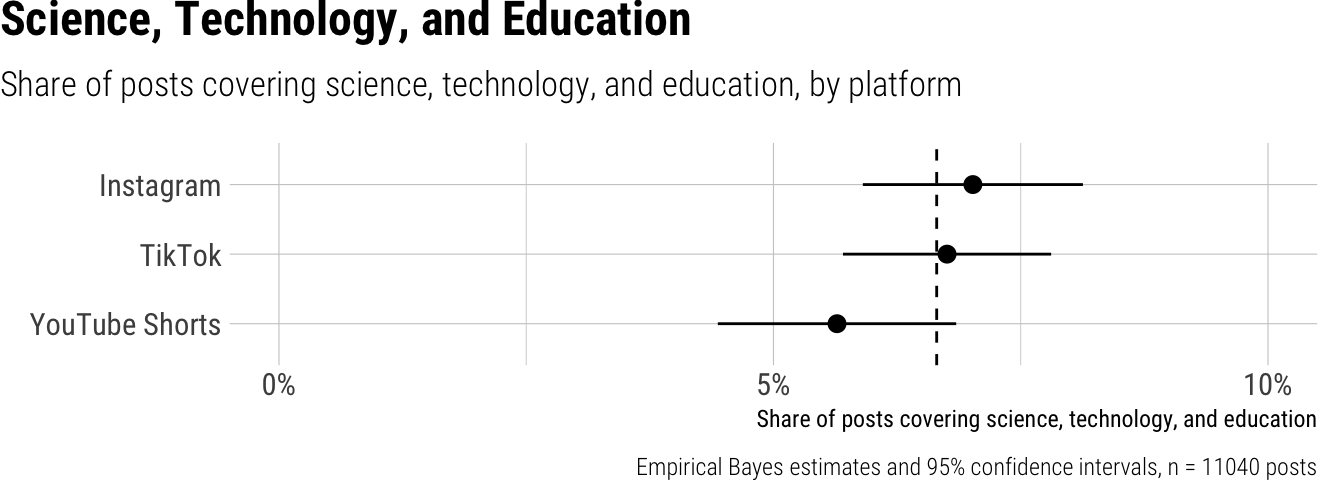
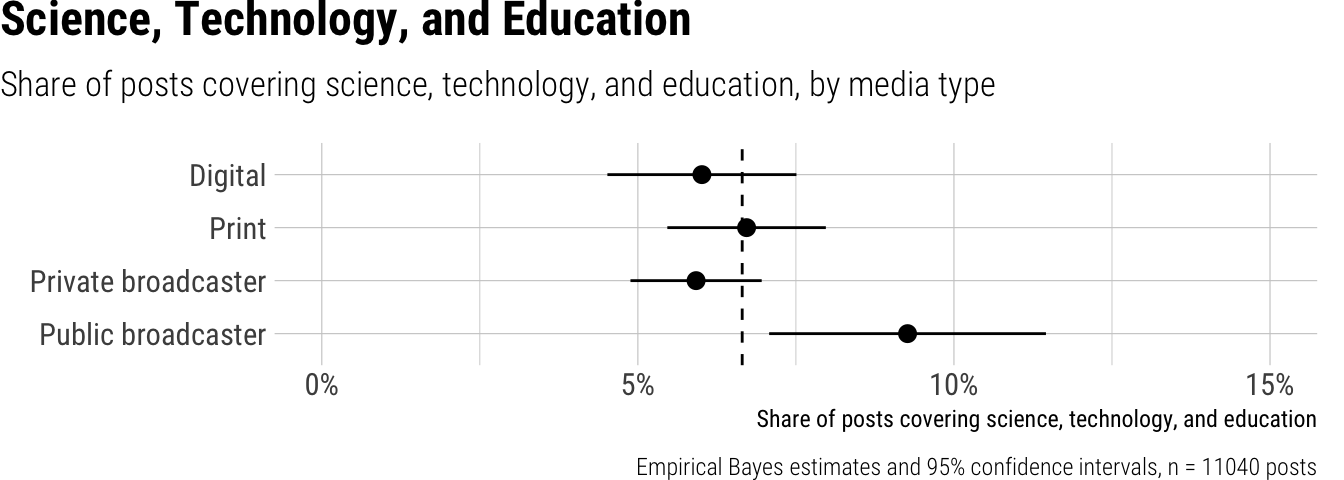
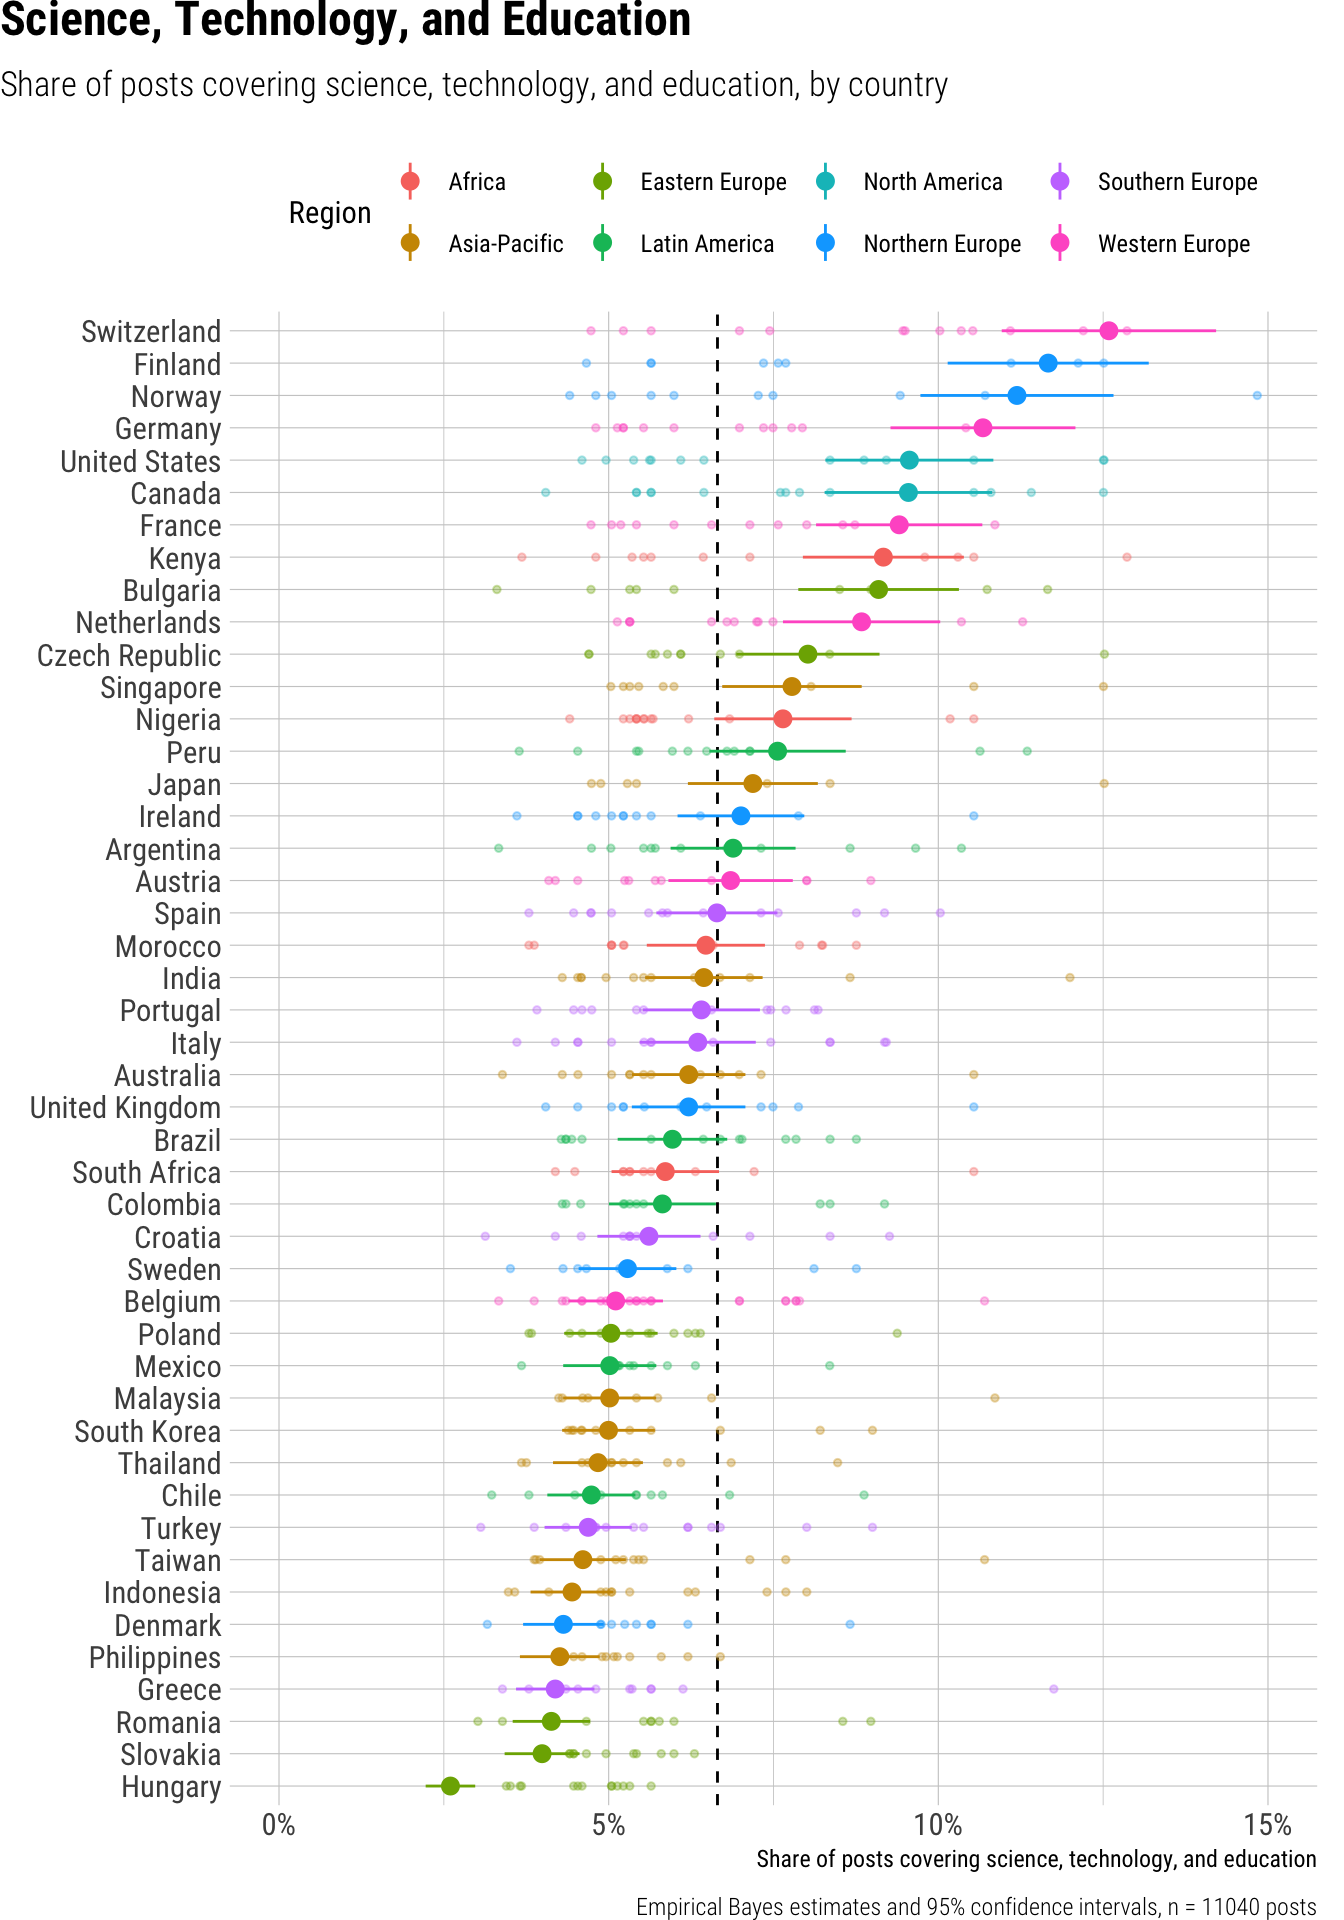
Across news outlets globally, we observed that science, technology, and education content constituted a relatively small share of short video posts, averaging 7%. While content platforms showed slight variations, with Instagram and TikTok each featuring science-related videos in 7% of their posts compared to YouTube Shorts at 6%, these differences were small and not statistically significant. Similarly, when examining outlet types, public broadcasters shared science, technology, and education content in 9% of their posts, a slightly higher proportion than digital, print, and private broadcaster outlets which hovered around 6% to 7%, but these distinctions also proved to be small and non-significant. However, we did find notable differences across countries, with Switzerland leading at 13% of posts dedicated to these topics, closely followed by Finland at 12%, Germany and Norway at 11%, and Canada and the United States both at 10%. In contrast, countries like Hungary posted significantly less, with only 3% of videos covering science, technology, and education, and others such as Denmark, Greece, Indonesia, the Philippines, Romania, and Slovakia also showed low shares at 4%.
Result tables for Topic: Science
Overall average
| estimate | p.value | conf.low | conf.high |
|---|---|---|---|
| 0.07 | 0 | 0.06 | 0.08 |
Contrasts
| term | contrast | estimate | p.value | conf.low | conf.high |
|---|---|---|---|---|---|
| outlet_type | Print - Digital | 0.00 | 0.73 | -0.01 | 0.02 |
| outlet_type | Private broadcaster - Digital | 0.00 | 0.61 | -0.02 | 0.01 |
| outlet_type | Public broadcaster - Digital | 0.02 | 0.06 | 0.00 | 0.05 |
| platform | TikTok - Instagram | 0.00 | 0.54 | -0.01 | 0.01 |
| platform | YouTube Shorts - Instagram | -0.01 | 0.08 | -0.03 | 0.00 |
Predictions by platform
| platform | estimate | p.value | conf.low | conf.high |
|---|---|---|---|---|
| 0.07 | 0 | 0.06 | 0.08 | |
| TikTok | 0.07 | 0 | 0.06 | 0.08 |
| YouTube Shorts | 0.06 | 0 | 0.04 | 0.07 |
Predictions by outlet type
| outlet_type | estimate | p.value | conf.low | conf.high |
|---|---|---|---|---|
| Digital | 0.06 | 0 | 0.05 | 0.08 |
| 0.07 | 0 | 0.05 | 0.08 | |
| Private broadcaster | 0.06 | 0 | 0.05 | 0.07 |
| Public broadcaster | 0.09 | 0 | 0.07 | 0.11 |
Predictions by country
| country | estimate | p.value | conf.low | conf.high | region |
|---|---|---|---|---|---|
| Argentina | 0.07 | 0 | 0.06 | 0.08 | Latin America |
| Australia | 0.06 | 0 | 0.05 | 0.07 | Asia-Pacific |
| Austria | 0.07 | 0 | 0.06 | 0.08 | Western Europe |
| Belgium | 0.05 | 0 | 0.04 | 0.06 | Western Europe |
| Brazil | 0.06 | 0 | 0.05 | 0.07 | Latin America |
| Bulgaria | 0.09 | 0 | 0.08 | 0.10 | Eastern Europe |
| Canada | 0.10 | 0 | 0.08 | 0.11 | North America |
| Chile | 0.05 | 0 | 0.04 | 0.05 | Latin America |
| Colombia | 0.06 | 0 | 0.05 | 0.07 | Latin America |
| Croatia | 0.06 | 0 | 0.05 | 0.06 | Southern Europe |
| Czech Republic | 0.08 | 0 | 0.07 | 0.09 | Eastern Europe |
| Denmark | 0.04 | 0 | 0.04 | 0.05 | Northern Europe |
| Finland | 0.12 | 0 | 0.10 | 0.13 | Northern Europe |
| France | 0.09 | 0 | 0.08 | 0.11 | Western Europe |
| Germany | 0.11 | 0 | 0.09 | 0.12 | Western Europe |
| Greece | 0.04 | 0 | 0.04 | 0.05 | Southern Europe |
| Hungary | 0.03 | 0 | 0.02 | 0.03 | Eastern Europe |
| India | 0.06 | 0 | 0.06 | 0.07 | Asia-Pacific |
| Indonesia | 0.04 | 0 | 0.04 | 0.05 | Asia-Pacific |
| Ireland | 0.07 | 0 | 0.06 | 0.08 | Northern Europe |
| Italy | 0.06 | 0 | 0.05 | 0.07 | Southern Europe |
| Japan | 0.07 | 0 | 0.06 | 0.08 | Asia-Pacific |
| Kenya | 0.09 | 0 | 0.08 | 0.10 | Africa |
| Malaysia | 0.05 | 0 | 0.04 | 0.06 | Asia-Pacific |
| Mexico | 0.05 | 0 | 0.04 | 0.06 | Latin America |
| Morocco | 0.06 | 0 | 0.06 | 0.07 | Africa |
| Netherlands | 0.09 | 0 | 0.08 | 0.10 | Western Europe |
| Nigeria | 0.08 | 0 | 0.07 | 0.09 | Africa |
| Norway | 0.11 | 0 | 0.10 | 0.13 | Northern Europe |
| Peru | 0.08 | 0 | 0.07 | 0.09 | Latin America |
| Philippines | 0.04 | 0 | 0.04 | 0.05 | Asia-Pacific |
| Poland | 0.05 | 0 | 0.04 | 0.06 | Eastern Europe |
| Portugal | 0.06 | 0 | 0.06 | 0.07 | Southern Europe |
| Romania | 0.04 | 0 | 0.04 | 0.05 | Eastern Europe |
| Singapore | 0.08 | 0 | 0.07 | 0.09 | Asia-Pacific |
| Slovakia | 0.04 | 0 | 0.03 | 0.05 | Eastern Europe |
| South Africa | 0.06 | 0 | 0.05 | 0.07 | Africa |
| South Korea | 0.05 | 0 | 0.04 | 0.06 | Asia-Pacific |
| Spain | 0.07 | 0 | 0.06 | 0.08 | Southern Europe |
| Sweden | 0.05 | 0 | 0.05 | 0.06 | Northern Europe |
| Switzerland | 0.13 | 0 | 0.11 | 0.14 | Western Europe |
| Taiwan | 0.05 | 0 | 0.04 | 0.05 | Asia-Pacific |
| Thailand | 0.05 | 0 | 0.04 | 0.06 | Asia-Pacific |
| Turkey | 0.05 | 0 | 0.04 | 0.05 | Southern Europe |
| United Kingdom | 0.06 | 0 | 0.05 | 0.07 | Northern Europe |
| United States | 0.10 | 0 | 0.08 | 0.11 | North America |
Culture and Arts
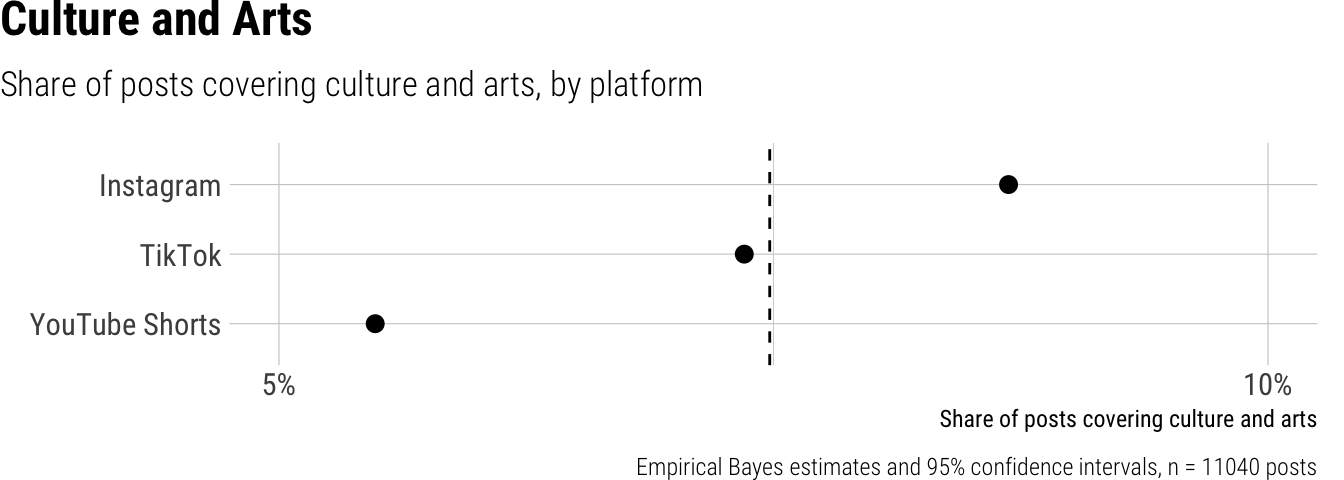
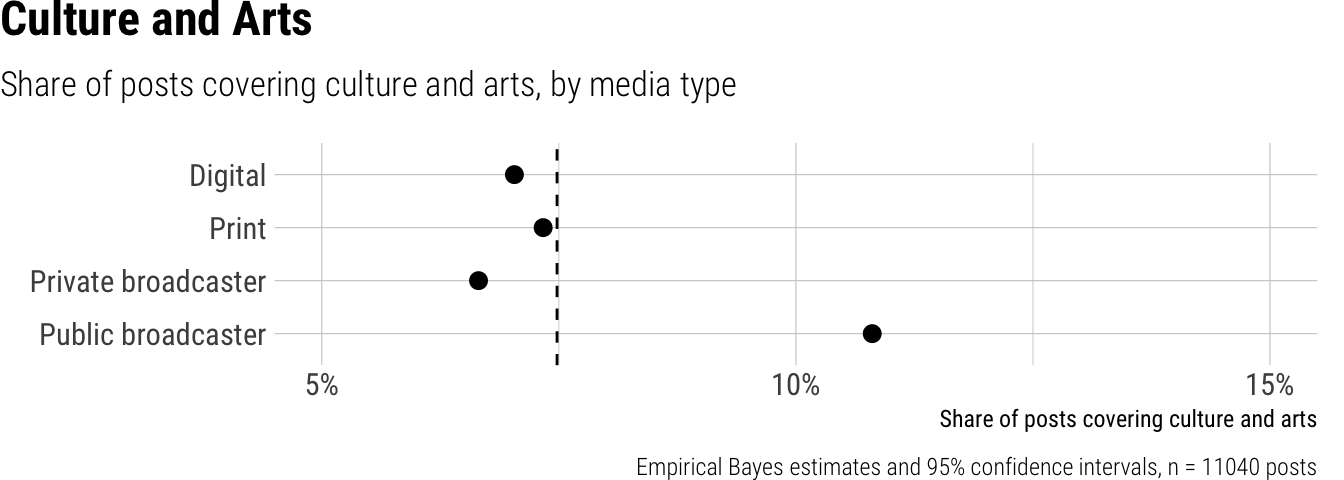
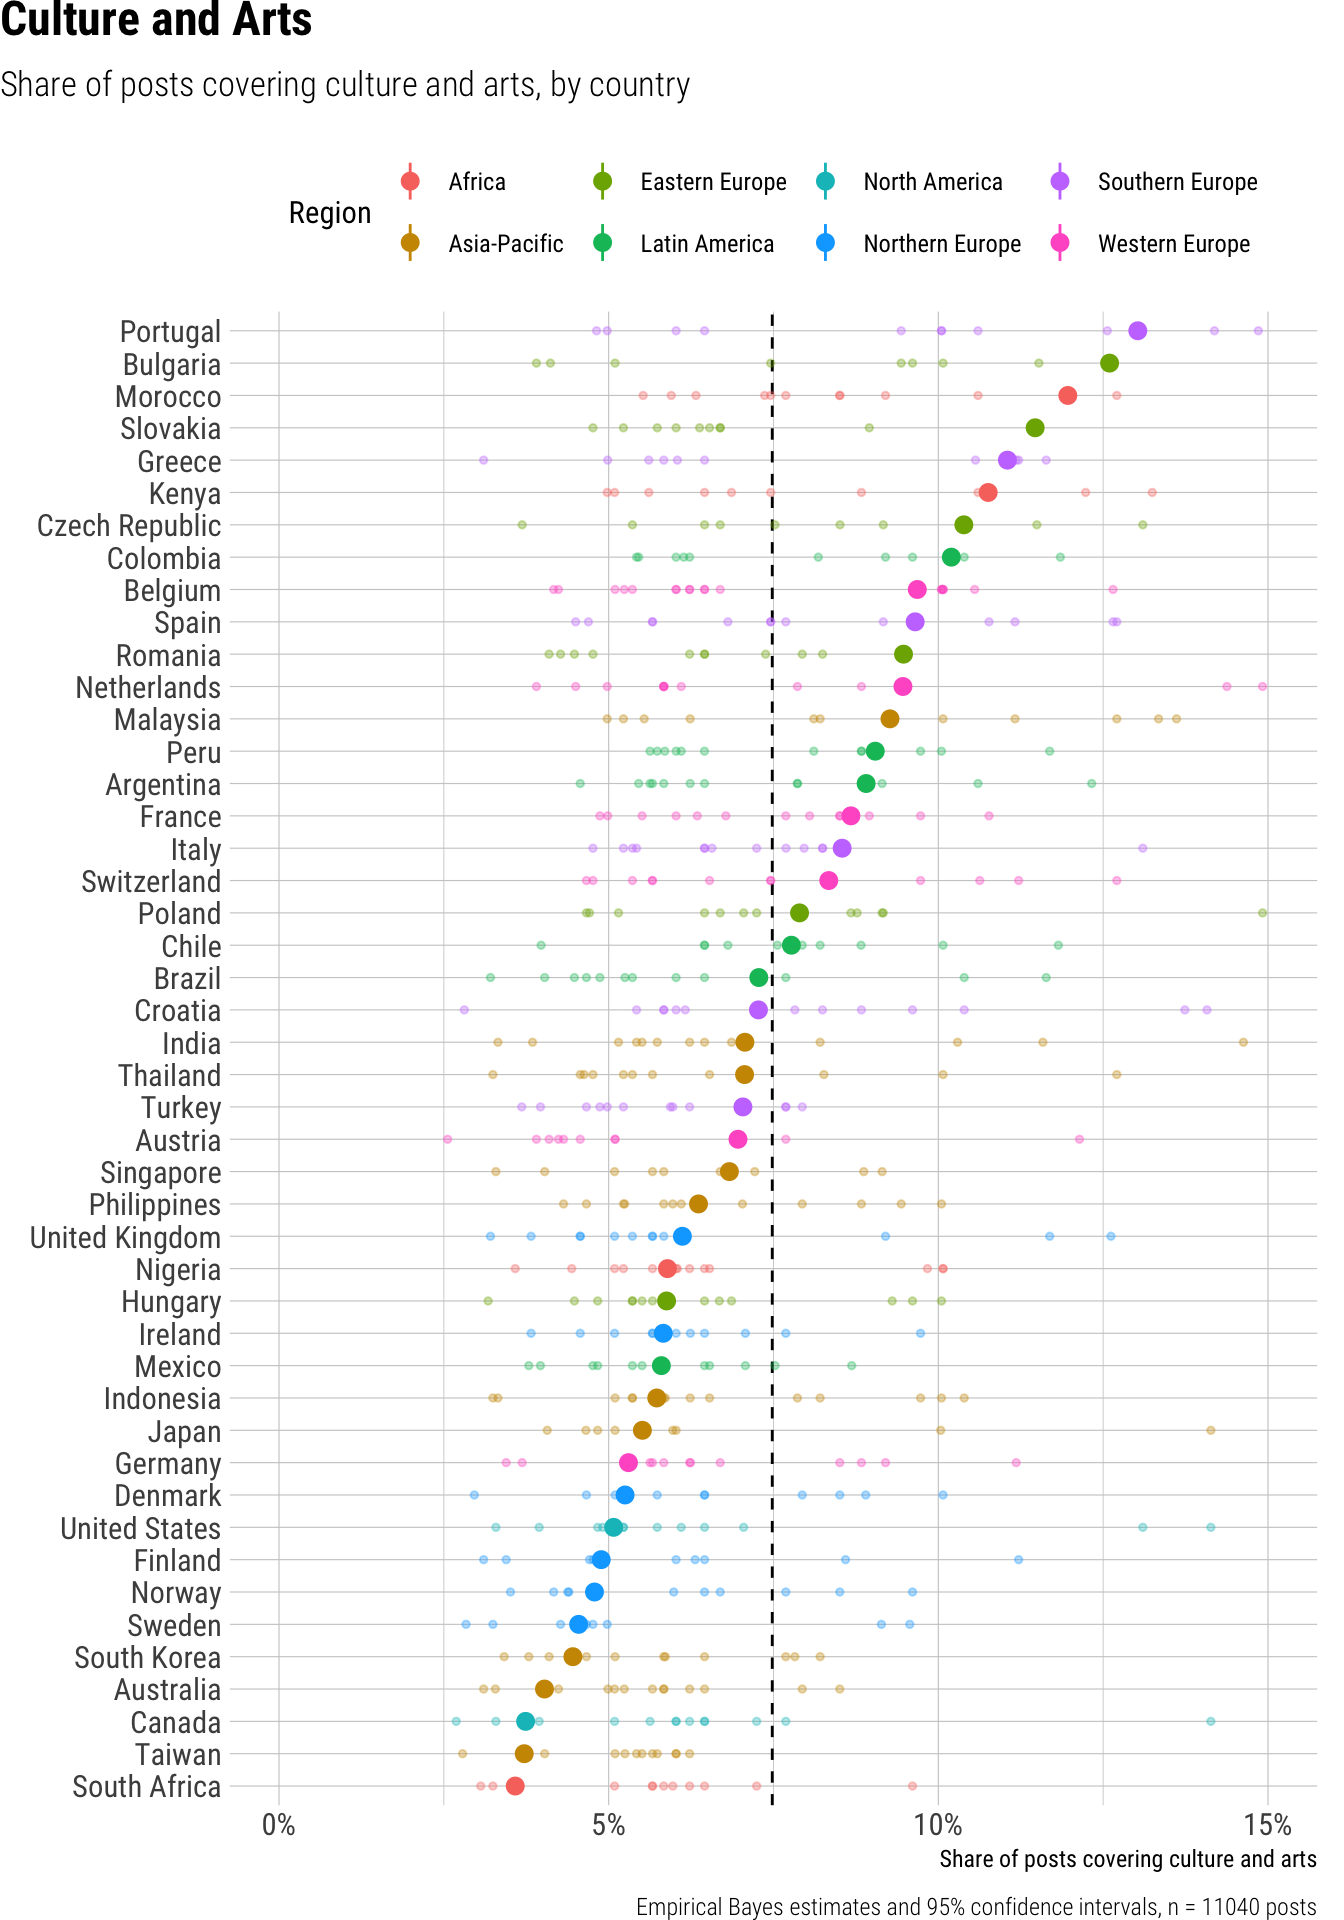
Across all news outlets and platforms, the analysis revealed that 7% of short video posts covered culture and arts content. We observed significant differences across platforms, with Instagram posts dedicating the highest share to these topics at 9%, followed by TikTok at 7%, and YouTube Shorts at 5%. Regarding outlet types, public broadcasters significantly stood out, allocating 11% of their posts to culture and arts. In comparison, digital, print, and private broadcaster outlets all showed a similar and substantially smaller commitment, with approximately 7% of their short videos covering these subjects, indicating practically negligible differences among these three types. Furthermore, the share of culture and arts content varied considerably by country, ranging from a low of 4% in nations like Australia, Canada, South Africa, South Korea, and Taiwan, to a high of 13% in Bulgaria and Portugal.
Result tables for Topic: Culture
Overall average
| estimate | p.value | conf.low | conf.high |
|---|---|---|---|
| 0.07 | 0 | 0.07 | 0.07 |
Contrasts
| term | contrast | estimate | p.value | conf.low | conf.high |
|---|---|---|---|---|---|
| outlet_type | Print - Digital | 0.00 | 0 | 0.00 | 0.00 |
| outlet_type | Private broadcaster - Digital | -0.01 | 0 | -0.01 | -0.01 |
| outlet_type | Public broadcaster - Digital | 0.05 | 0 | 0.05 | 0.05 |
| platform | TikTok - Instagram | -0.01 | 0 | -0.01 | -0.01 |
| platform | YouTube Shorts - Instagram | -0.02 | 0 | -0.02 | -0.02 |
Predictions by platform
| platform | estimate | p.value | conf.low | conf.high |
|---|---|---|---|---|
| 0.09 | 0 | 0.09 | 0.09 | |
| TikTok | 0.07 | 0 | 0.07 | 0.07 |
| YouTube Shorts | 0.05 | 0 | 0.05 | 0.05 |
Predictions by outlet type
| outlet_type | estimate | p.value | conf.low | conf.high |
|---|---|---|---|---|
| Digital | 0.07 | 0 | 0.07 | 0.07 |
| 0.07 | 0 | 0.07 | 0.07 | |
| Private broadcaster | 0.07 | 0 | 0.07 | 0.07 |
| Public broadcaster | 0.11 | 0 | 0.11 | 0.11 |
Predictions by country
| country | estimate | p.value | conf.low | conf.high | region |
|---|---|---|---|---|---|
| Argentina | 0.09 | 0 | 0.09 | 0.09 | Latin America |
| Australia | 0.04 | 0 | 0.04 | 0.04 | Asia-Pacific |
| Austria | 0.07 | 0 | 0.07 | 0.07 | Western Europe |
| Belgium | 0.10 | 0 | 0.10 | 0.10 | Western Europe |
| Brazil | 0.07 | 0 | 0.07 | 0.07 | Latin America |
| Bulgaria | 0.13 | 0 | 0.13 | 0.13 | Eastern Europe |
| Canada | 0.04 | 0 | 0.04 | 0.04 | North America |
| Chile | 0.08 | 0 | 0.08 | 0.08 | Latin America |
| Colombia | 0.10 | 0 | 0.10 | 0.10 | Latin America |
| Croatia | 0.07 | 0 | 0.07 | 0.07 | Southern Europe |
| Czech Republic | 0.10 | 0 | 0.10 | 0.10 | Eastern Europe |
| Denmark | 0.05 | 0 | 0.05 | 0.05 | Northern Europe |
| Finland | 0.05 | 0 | 0.05 | 0.05 | Northern Europe |
| France | 0.09 | 0 | 0.09 | 0.09 | Western Europe |
| Germany | 0.05 | 0 | 0.05 | 0.05 | Western Europe |
| Greece | 0.11 | 0 | 0.11 | 0.11 | Southern Europe |
| Hungary | 0.06 | 0 | 0.06 | 0.06 | Eastern Europe |
| India | 0.07 | 0 | 0.07 | 0.07 | Asia-Pacific |
| Indonesia | 0.06 | 0 | 0.06 | 0.06 | Asia-Pacific |
| Ireland | 0.06 | 0 | 0.06 | 0.06 | Northern Europe |
| Italy | 0.09 | 0 | 0.09 | 0.09 | Southern Europe |
| Japan | 0.06 | 0 | 0.06 | 0.06 | Asia-Pacific |
| Kenya | 0.11 | 0 | 0.11 | 0.11 | Africa |
| Malaysia | 0.09 | 0 | 0.09 | 0.09 | Asia-Pacific |
| Mexico | 0.06 | 0 | 0.06 | 0.06 | Latin America |
| Morocco | 0.12 | 0 | 0.12 | 0.12 | Africa |
| Netherlands | 0.09 | 0 | 0.09 | 0.09 | Western Europe |
| Nigeria | 0.06 | 0 | 0.06 | 0.06 | Africa |
| Norway | 0.05 | 0 | 0.05 | 0.05 | Northern Europe |
| Peru | 0.09 | 0 | 0.09 | 0.09 | Latin America |
| Philippines | 0.06 | 0 | 0.06 | 0.06 | Asia-Pacific |
| Poland | 0.08 | 0 | 0.08 | 0.08 | Eastern Europe |
| Portugal | 0.13 | 0 | 0.13 | 0.13 | Southern Europe |
| Romania | 0.09 | 0 | 0.09 | 0.09 | Eastern Europe |
| Singapore | 0.07 | 0 | 0.07 | 0.07 | Asia-Pacific |
| Slovakia | 0.11 | 0 | 0.11 | 0.11 | Eastern Europe |
| South Africa | 0.04 | 0 | 0.04 | 0.04 | Africa |
| South Korea | 0.04 | 0 | 0.04 | 0.04 | Asia-Pacific |
| Spain | 0.10 | 0 | 0.10 | 0.10 | Southern Europe |
| Sweden | 0.05 | 0 | 0.05 | 0.05 | Northern Europe |
| Switzerland | 0.08 | 0 | 0.08 | 0.08 | Western Europe |
| Taiwan | 0.04 | 0 | 0.04 | 0.04 | Asia-Pacific |
| Thailand | 0.07 | 0 | 0.07 | 0.07 | Asia-Pacific |
| Turkey | 0.07 | 0 | 0.07 | 0.07 | Southern Europe |
| United Kingdom | 0.06 | 0 | 0.06 | 0.06 | Northern Europe |
| United States | 0.05 | 0 | 0.05 | 0.05 | North America |
Lifestyle and Travel
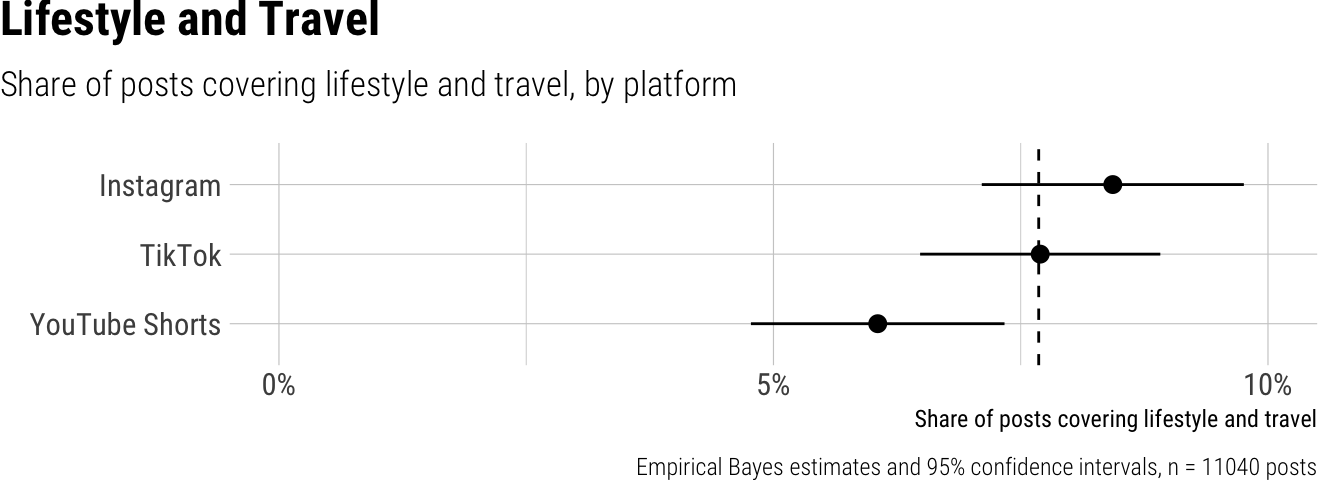
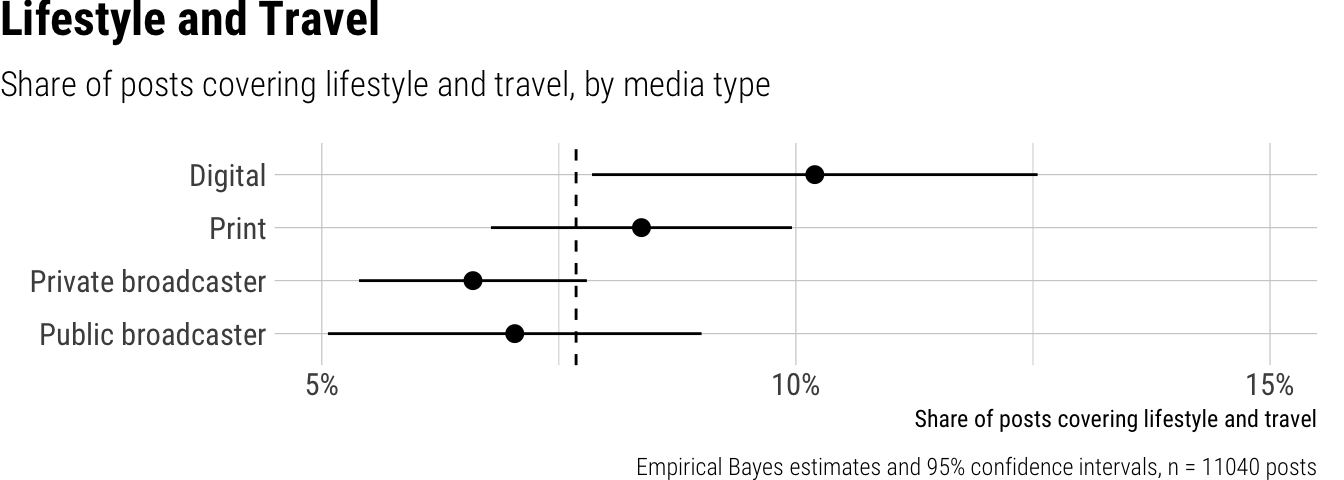
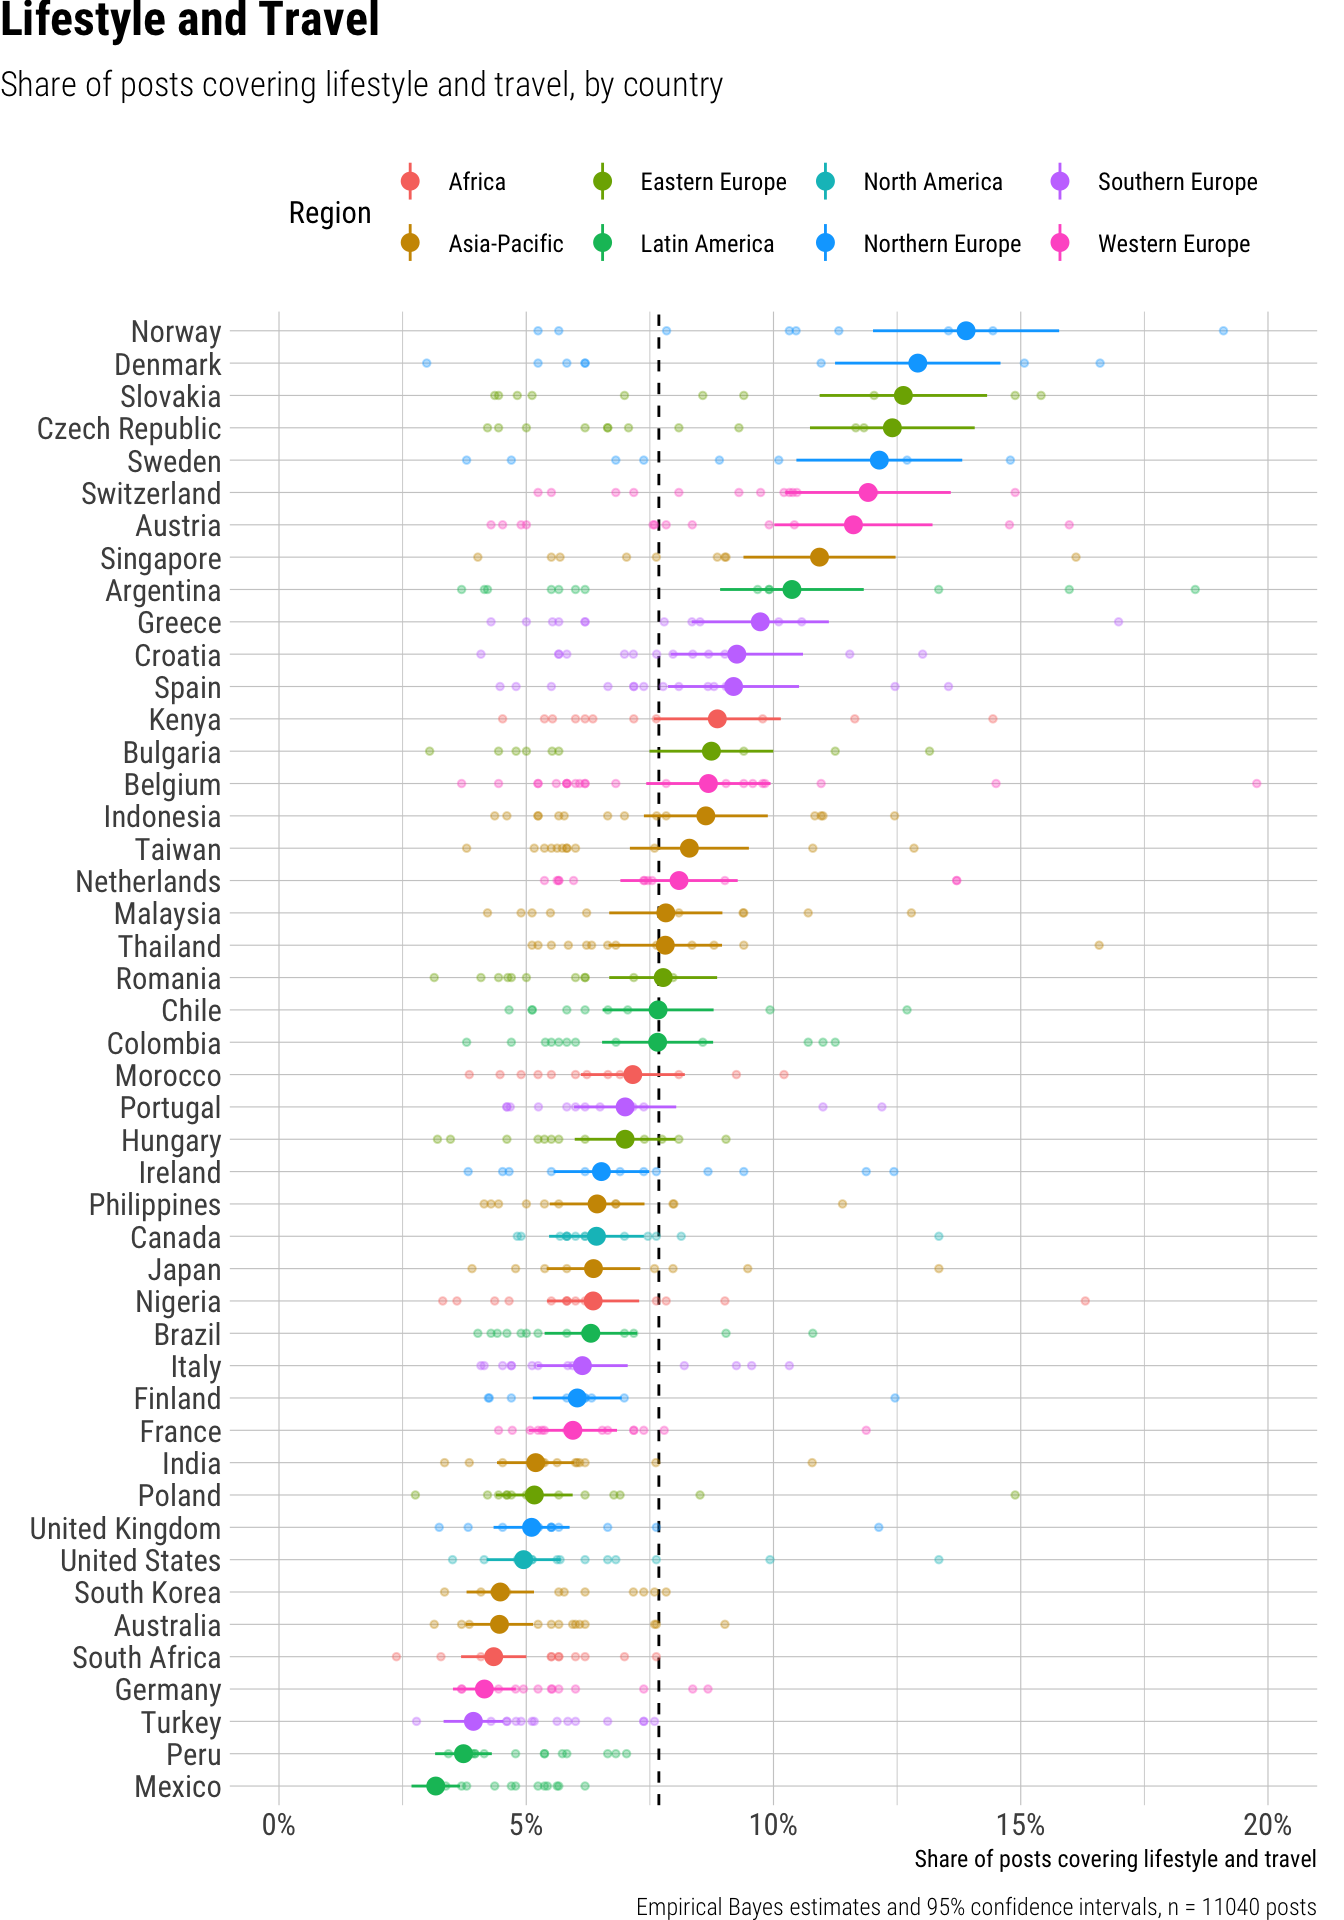
Across all news outlets and platforms, the average share of short video posts dedicated to lifestyle and travel content was 8%. Significant differences emerged across platforms, with Instagram and TikTok allocating a similar proportion of around 8% to this content, while YouTube Shorts featured a notably lower share, at 6%. Outlet types also displayed distinct patterns; digital news outlets dedicated the highest proportion of their short videos to lifestyle and travel at 10%, which was significantly higher than the 7% observed for private broadcasters and public broadcasters, while print outlets were at 8%. Country-level variations were substantial, with posts ranging from lows of 3% in Mexico, and 4% in Australia, Germany, Peru, South Africa, South Korea, and Turkey, to highs of 14% in Norway, and 13% in Denmark and Slovakia.
Result tables for Topic: Lifestyle
Overall average
| estimate | p.value | conf.low | conf.high |
|---|---|---|---|
| 0.08 | 0 | 0.07 | 0.09 |
Contrasts
| term | contrast | estimate | p.value | conf.low | conf.high |
|---|---|---|---|---|---|
| outlet_type | Print - Digital | -0.01 | 0.22 | -0.04 | 0.01 |
| outlet_type | Private broadcaster - Digital | -0.03 | 0.03 | -0.05 | 0.00 |
| outlet_type | Public broadcaster - Digital | -0.02 | 0.10 | -0.05 | 0.00 |
| platform | TikTok - Instagram | -0.01 | 0.30 | -0.02 | 0.01 |
| platform | YouTube Shorts - Instagram | -0.02 | 0.02 | -0.03 | 0.00 |
Predictions by platform
| platform | estimate | p.value | conf.low | conf.high |
|---|---|---|---|---|
| 0.08 | 0 | 0.07 | 0.10 | |
| TikTok | 0.08 | 0 | 0.06 | 0.09 |
| YouTube Shorts | 0.06 | 0 | 0.05 | 0.07 |
Predictions by outlet type
| outlet_type | estimate | p.value | conf.low | conf.high |
|---|---|---|---|---|
| Digital | 0.10 | 0 | 0.08 | 0.13 |
| 0.08 | 0 | 0.07 | 0.10 | |
| Private broadcaster | 0.07 | 0 | 0.05 | 0.08 |
| Public broadcaster | 0.07 | 0 | 0.05 | 0.09 |
Predictions by country
| country | estimate | p.value | conf.low | conf.high | region |
|---|---|---|---|---|---|
| Argentina | 0.10 | 0 | 0.09 | 0.12 | Latin America |
| Australia | 0.04 | 0 | 0.04 | 0.05 | Asia-Pacific |
| Austria | 0.12 | 0 | 0.10 | 0.13 | Western Europe |
| Belgium | 0.09 | 0 | 0.07 | 0.10 | Western Europe |
| Brazil | 0.06 | 0 | 0.05 | 0.07 | Latin America |
| Bulgaria | 0.09 | 0 | 0.07 | 0.10 | Eastern Europe |
| Canada | 0.06 | 0 | 0.05 | 0.07 | North America |
| Chile | 0.08 | 0 | 0.07 | 0.09 | Latin America |
| Colombia | 0.08 | 0 | 0.07 | 0.09 | Latin America |
| Croatia | 0.09 | 0 | 0.08 | 0.11 | Southern Europe |
| Czech Republic | 0.12 | 0 | 0.11 | 0.14 | Eastern Europe |
| Denmark | 0.13 | 0 | 0.11 | 0.15 | Northern Europe |
| Finland | 0.06 | 0 | 0.05 | 0.07 | Northern Europe |
| France | 0.06 | 0 | 0.05 | 0.07 | Western Europe |
| Germany | 0.04 | 0 | 0.04 | 0.05 | Western Europe |
| Greece | 0.10 | 0 | 0.08 | 0.11 | Southern Europe |
| Hungary | 0.07 | 0 | 0.06 | 0.08 | Eastern Europe |
| India | 0.05 | 0 | 0.04 | 0.06 | Asia-Pacific |
| Indonesia | 0.09 | 0 | 0.07 | 0.10 | Asia-Pacific |
| Ireland | 0.07 | 0 | 0.06 | 0.07 | Northern Europe |
| Italy | 0.06 | 0 | 0.05 | 0.07 | Southern Europe |
| Japan | 0.06 | 0 | 0.05 | 0.07 | Asia-Pacific |
| Kenya | 0.09 | 0 | 0.08 | 0.10 | Africa |
| Malaysia | 0.08 | 0 | 0.07 | 0.09 | Asia-Pacific |
| Mexico | 0.03 | 0 | 0.03 | 0.04 | Latin America |
| Morocco | 0.07 | 0 | 0.06 | 0.08 | Africa |
| Netherlands | 0.08 | 0 | 0.07 | 0.09 | Western Europe |
| Nigeria | 0.06 | 0 | 0.05 | 0.07 | Africa |
| Norway | 0.14 | 0 | 0.12 | 0.16 | Northern Europe |
| Peru | 0.04 | 0 | 0.03 | 0.04 | Latin America |
| Philippines | 0.06 | 0 | 0.05 | 0.07 | Asia-Pacific |
| Poland | 0.05 | 0 | 0.04 | 0.06 | Eastern Europe |
| Portugal | 0.07 | 0 | 0.06 | 0.08 | Southern Europe |
| Romania | 0.08 | 0 | 0.07 | 0.09 | Eastern Europe |
| Singapore | 0.11 | 0 | 0.09 | 0.12 | Asia-Pacific |
| Slovakia | 0.13 | 0 | 0.11 | 0.14 | Eastern Europe |
| South Africa | 0.04 | 0 | 0.04 | 0.05 | Africa |
| South Korea | 0.04 | 0 | 0.04 | 0.05 | Asia-Pacific |
| Spain | 0.09 | 0 | 0.08 | 0.11 | Southern Europe |
| Sweden | 0.12 | 0 | 0.10 | 0.14 | Northern Europe |
| Switzerland | 0.12 | 0 | 0.10 | 0.14 | Western Europe |
| Taiwan | 0.08 | 0 | 0.07 | 0.10 | Asia-Pacific |
| Thailand | 0.08 | 0 | 0.07 | 0.09 | Asia-Pacific |
| Turkey | 0.04 | 0 | 0.03 | 0.05 | Southern Europe |
| United Kingdom | 0.05 | 0 | 0.04 | 0.06 | Northern Europe |
| United States | 0.05 | 0 | 0.04 | 0.06 | North America |
Fashion and Beauty
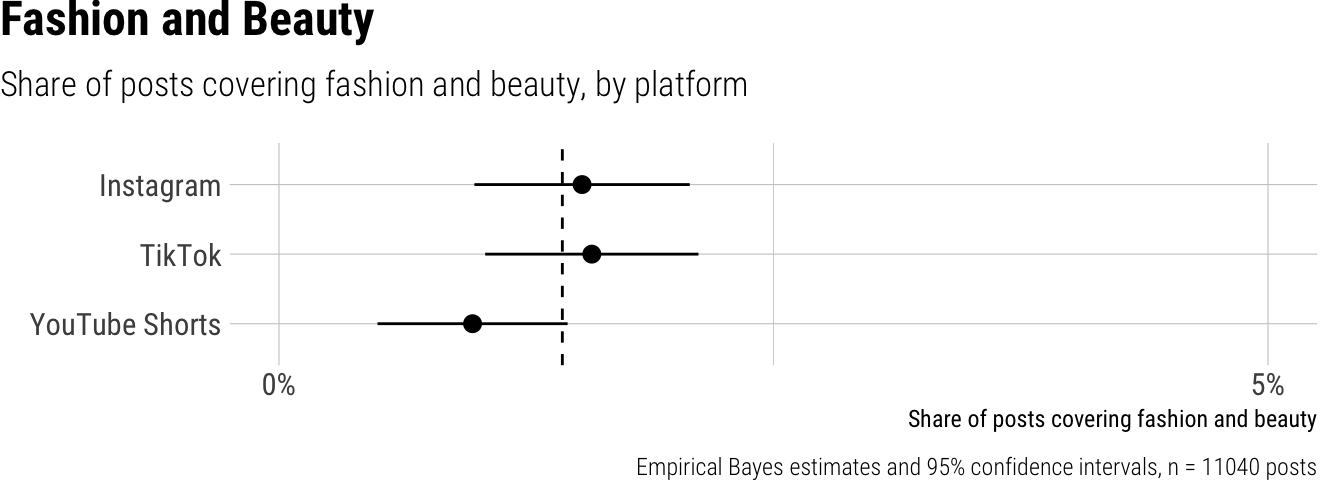
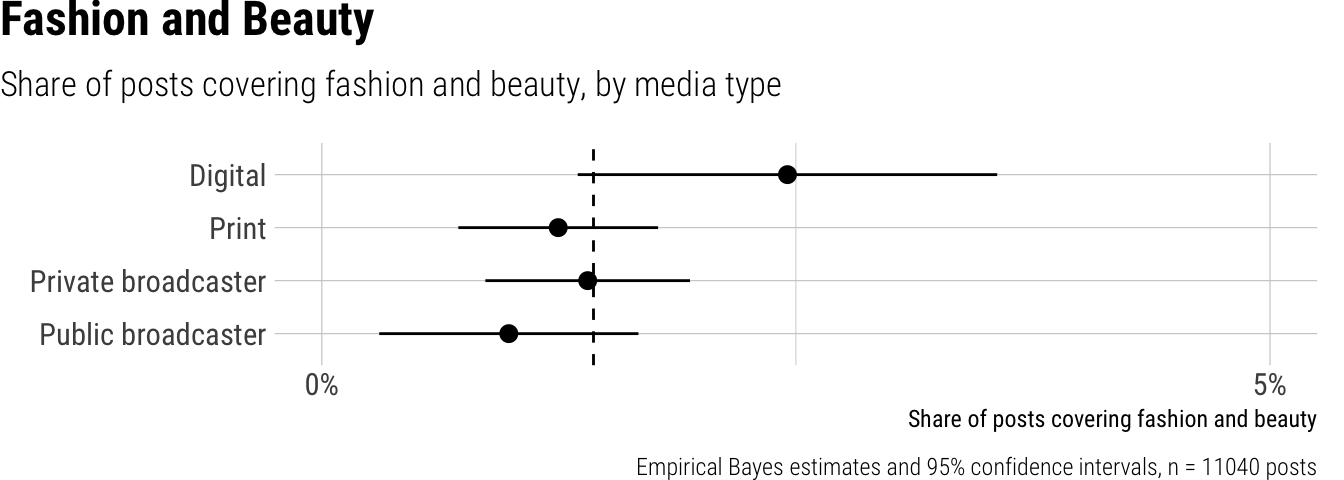
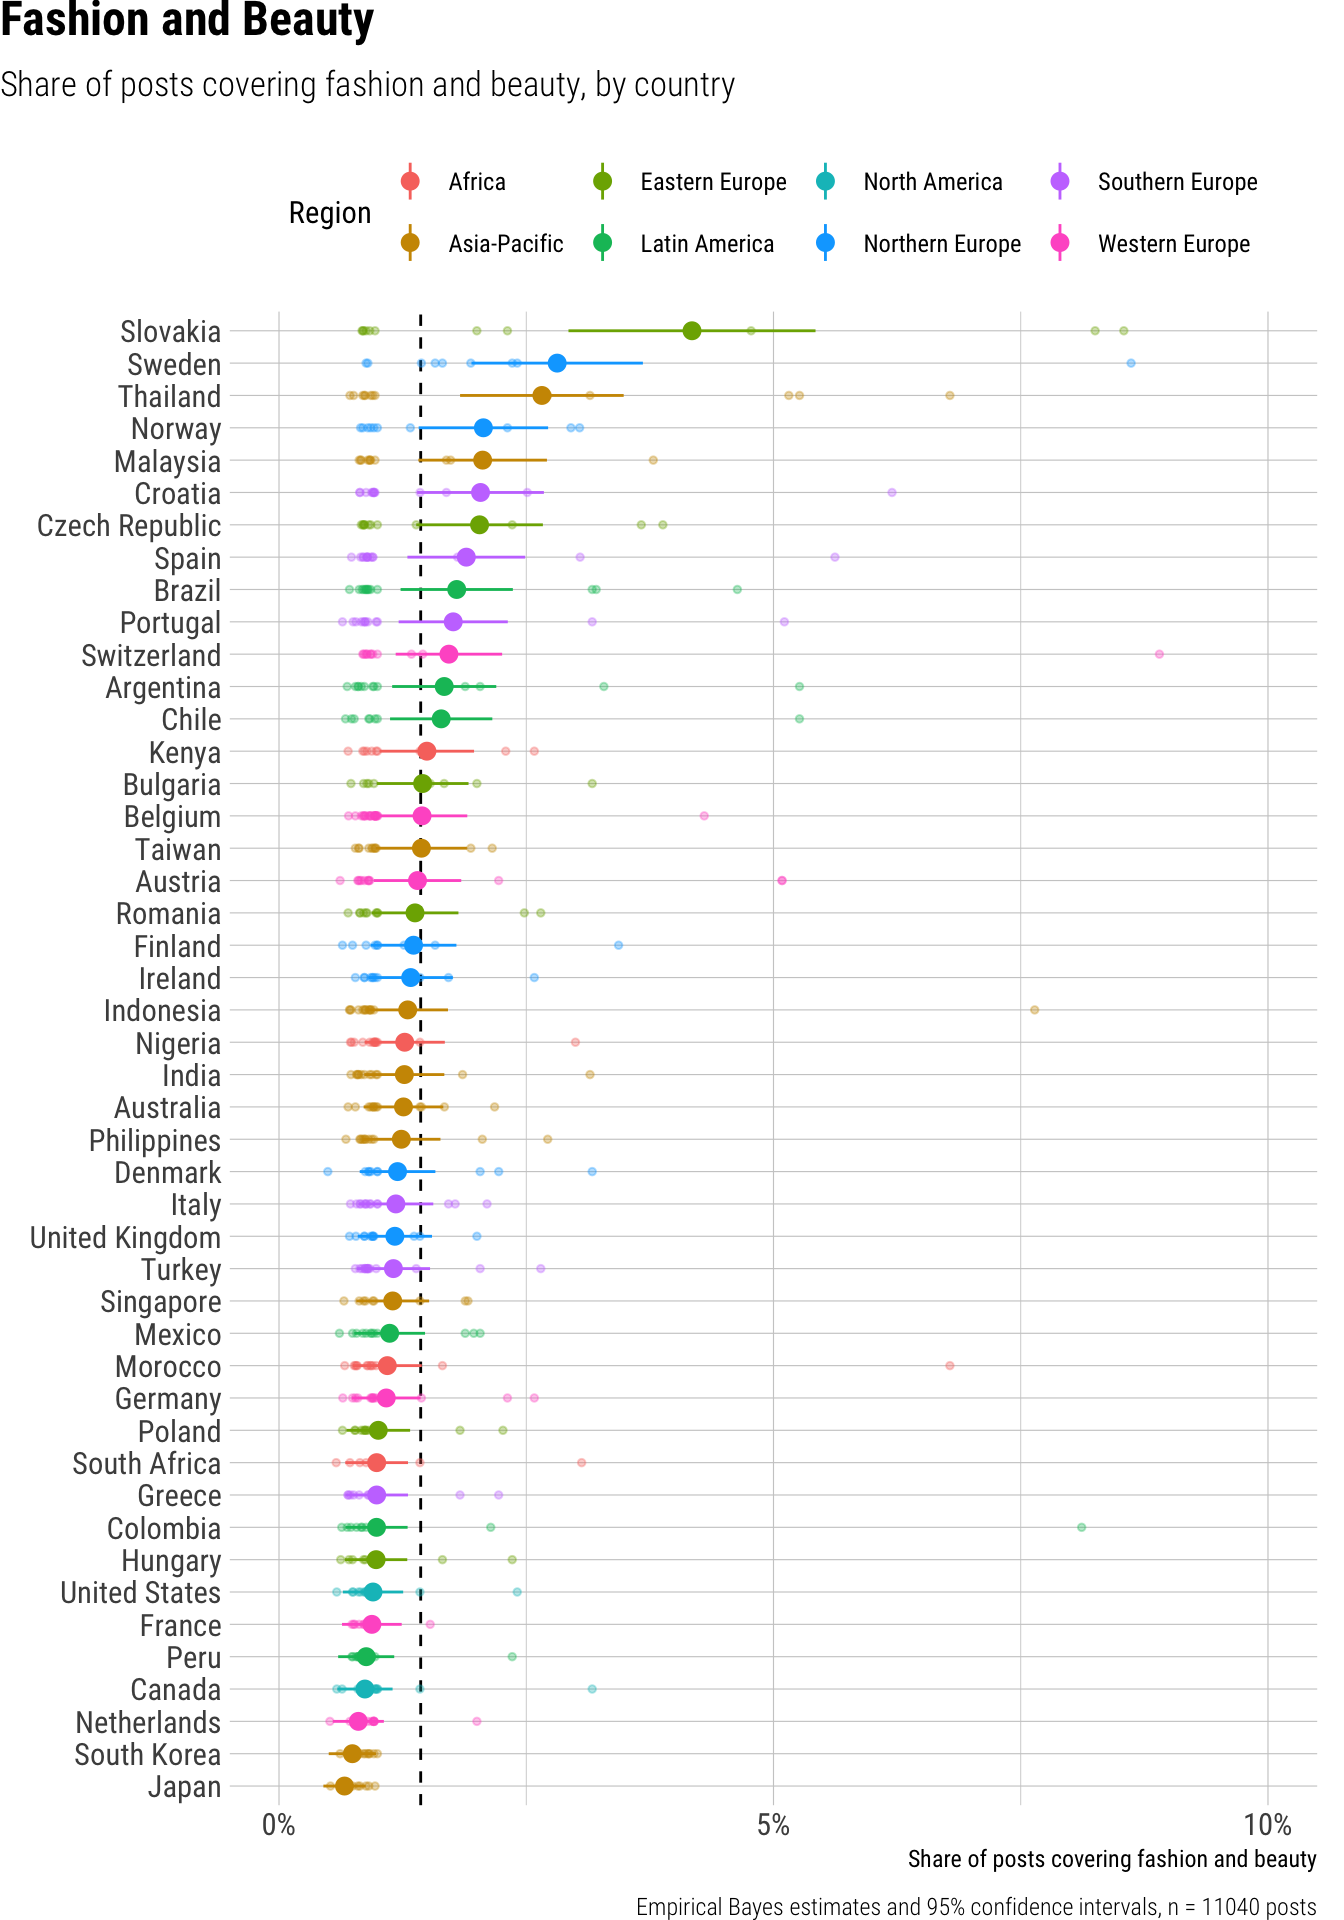
Short video posts covering fashion and beauty made up a modest 1% of all content shared by news outlets globally. We observed differences in this coverage across platforms, with both Instagram and TikTok dedicating 2% of their posts to fashion and beauty, double the proportion seen on YouTube Shorts, which stood at 1%. Outlet type also showed significant variation, as digital news outlets covered fashion and beauty in 2% of their short videos, a noticeably higher share compared to print outlets and public broadcasters, both of which allocated 1% of their posts to this category. Private broadcasters also showed 1% coverage. While many countries aligned with the overall average, we noted some variation, with Slovakia posting the highest proportion at 4% of content on fashion and beauty, whereas countries such as Japan, Colombia, and the United States were among those at the lower end with 1%.
Result tables for Topic: Fashion
Overall average
| estimate | p.value | conf.low | conf.high |
|---|---|---|---|
| 0.01 | 0 | 0.01 | 0.02 |
Contrasts
| term | contrast | estimate | p.value | conf.low | conf.high |
|---|---|---|---|---|---|
| outlet_type | Print - Digital | -0.01 | 0.04 | -0.02 | 0.00 |
| outlet_type | Private broadcaster - Digital | -0.01 | 0.06 | -0.02 | 0.00 |
| outlet_type | Public broadcaster - Digital | -0.02 | 0.01 | -0.03 | 0.00 |
| platform | TikTok - Instagram | 0.00 | 0.73 | 0.00 | 0.01 |
| platform | YouTube Shorts - Instagram | 0.00 | 0.10 | -0.01 | 0.00 |
Predictions by platform
| platform | estimate | p.value | conf.low | conf.high |
|---|---|---|---|---|
| 0.02 | 0 | 0.01 | 0.02 | |
| TikTok | 0.02 | 0 | 0.01 | 0.02 |
| YouTube Shorts | 0.01 | 0 | 0.00 | 0.01 |
Predictions by outlet type
| outlet_type | estimate | p.value | conf.low | conf.high |
|---|---|---|---|---|
| Digital | 0.02 | 0 | 0.01 | 0.04 |
| 0.01 | 0 | 0.01 | 0.02 | |
| Private broadcaster | 0.01 | 0 | 0.01 | 0.02 |
| Public broadcaster | 0.01 | 0 | 0.00 | 0.02 |
Predictions by country
| country | estimate | p.value | conf.low | conf.high | region |
|---|---|---|---|---|---|
| Argentina | 0.02 | 0 | 0.01 | 0.02 | Latin America |
| Australia | 0.01 | 0 | 0.01 | 0.02 | Asia-Pacific |
| Austria | 0.01 | 0 | 0.01 | 0.02 | Western Europe |
| Belgium | 0.01 | 0 | 0.01 | 0.02 | Western Europe |
| Brazil | 0.02 | 0 | 0.01 | 0.02 | Latin America |
| Bulgaria | 0.01 | 0 | 0.01 | 0.02 | Eastern Europe |
| Canada | 0.01 | 0 | 0.01 | 0.01 | North America |
| Chile | 0.02 | 0 | 0.01 | 0.02 | Latin America |
| Colombia | 0.01 | 0 | 0.01 | 0.01 | Latin America |
| Croatia | 0.02 | 0 | 0.01 | 0.03 | Southern Europe |
| Czech Republic | 0.02 | 0 | 0.01 | 0.03 | Eastern Europe |
| Denmark | 0.01 | 0 | 0.01 | 0.02 | Northern Europe |
| Finland | 0.01 | 0 | 0.01 | 0.02 | Northern Europe |
| France | 0.01 | 0 | 0.01 | 0.01 | Western Europe |
| Germany | 0.01 | 0 | 0.01 | 0.01 | Western Europe |
| Greece | 0.01 | 0 | 0.01 | 0.01 | Southern Europe |
| Hungary | 0.01 | 0 | 0.01 | 0.01 | Eastern Europe |
| India | 0.01 | 0 | 0.01 | 0.02 | Asia-Pacific |
| Indonesia | 0.01 | 0 | 0.01 | 0.02 | Asia-Pacific |
| Ireland | 0.01 | 0 | 0.01 | 0.02 | Northern Europe |
| Italy | 0.01 | 0 | 0.01 | 0.02 | Southern Europe |
| Japan | 0.01 | 0 | 0.00 | 0.01 | Asia-Pacific |
| Kenya | 0.01 | 0 | 0.01 | 0.02 | Africa |
| Malaysia | 0.02 | 0 | 0.01 | 0.03 | Asia-Pacific |
| Mexico | 0.01 | 0 | 0.01 | 0.01 | Latin America |
| Morocco | 0.01 | 0 | 0.01 | 0.01 | Africa |
| Netherlands | 0.01 | 0 | 0.01 | 0.01 | Western Europe |
| Nigeria | 0.01 | 0 | 0.01 | 0.02 | Africa |
| Norway | 0.02 | 0 | 0.01 | 0.03 | Northern Europe |
| Peru | 0.01 | 0 | 0.01 | 0.01 | Latin America |
| Philippines | 0.01 | 0 | 0.01 | 0.02 | Asia-Pacific |
| Poland | 0.01 | 0 | 0.01 | 0.01 | Eastern Europe |
| Portugal | 0.02 | 0 | 0.01 | 0.02 | Southern Europe |
| Romania | 0.01 | 0 | 0.01 | 0.02 | Eastern Europe |
| Singapore | 0.01 | 0 | 0.01 | 0.02 | Asia-Pacific |
| Slovakia | 0.04 | 0 | 0.03 | 0.05 | Eastern Europe |
| South Africa | 0.01 | 0 | 0.01 | 0.01 | Africa |
| South Korea | 0.01 | 0 | 0.01 | 0.01 | Asia-Pacific |
| Spain | 0.02 | 0 | 0.01 | 0.02 | Southern Europe |
| Sweden | 0.03 | 0 | 0.02 | 0.04 | Northern Europe |
| Switzerland | 0.02 | 0 | 0.01 | 0.02 | Western Europe |
| Taiwan | 0.01 | 0 | 0.01 | 0.02 | Asia-Pacific |
| Thailand | 0.03 | 0 | 0.02 | 0.03 | Asia-Pacific |
| Turkey | 0.01 | 0 | 0.01 | 0.02 | Southern Europe |
| United Kingdom | 0.01 | 0 | 0.01 | 0.02 | Northern Europe |
| United States | 0.01 | 0 | 0.01 | 0.01 | North America |
Food and Cooking
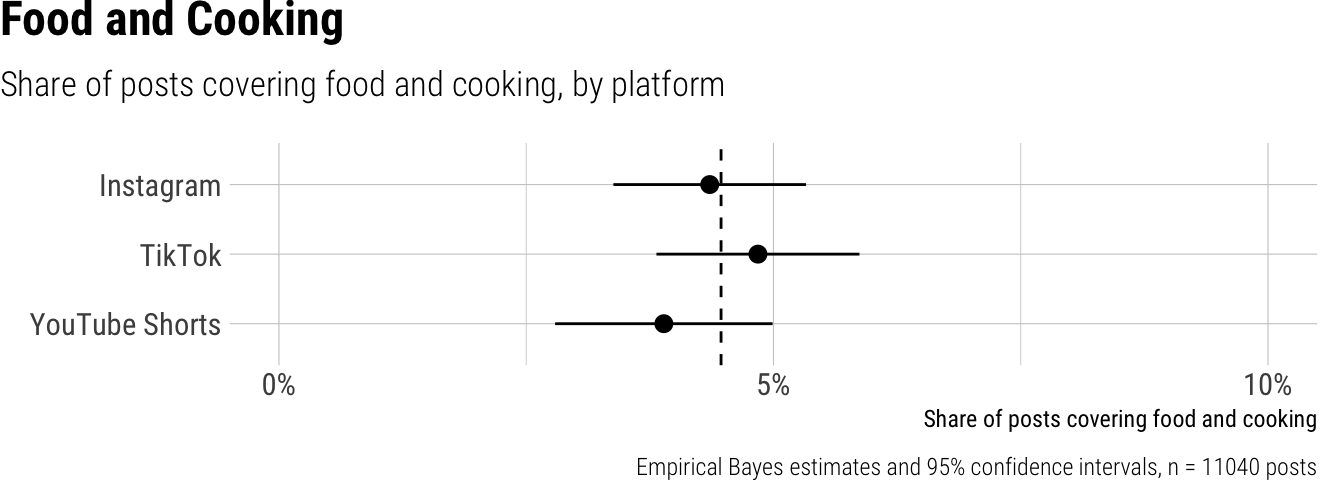
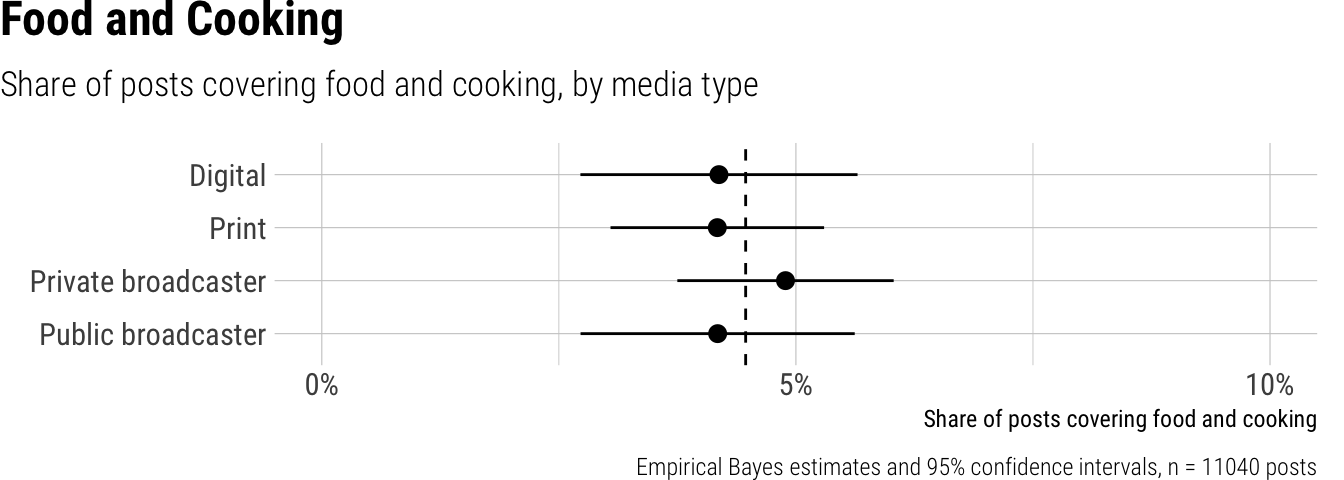
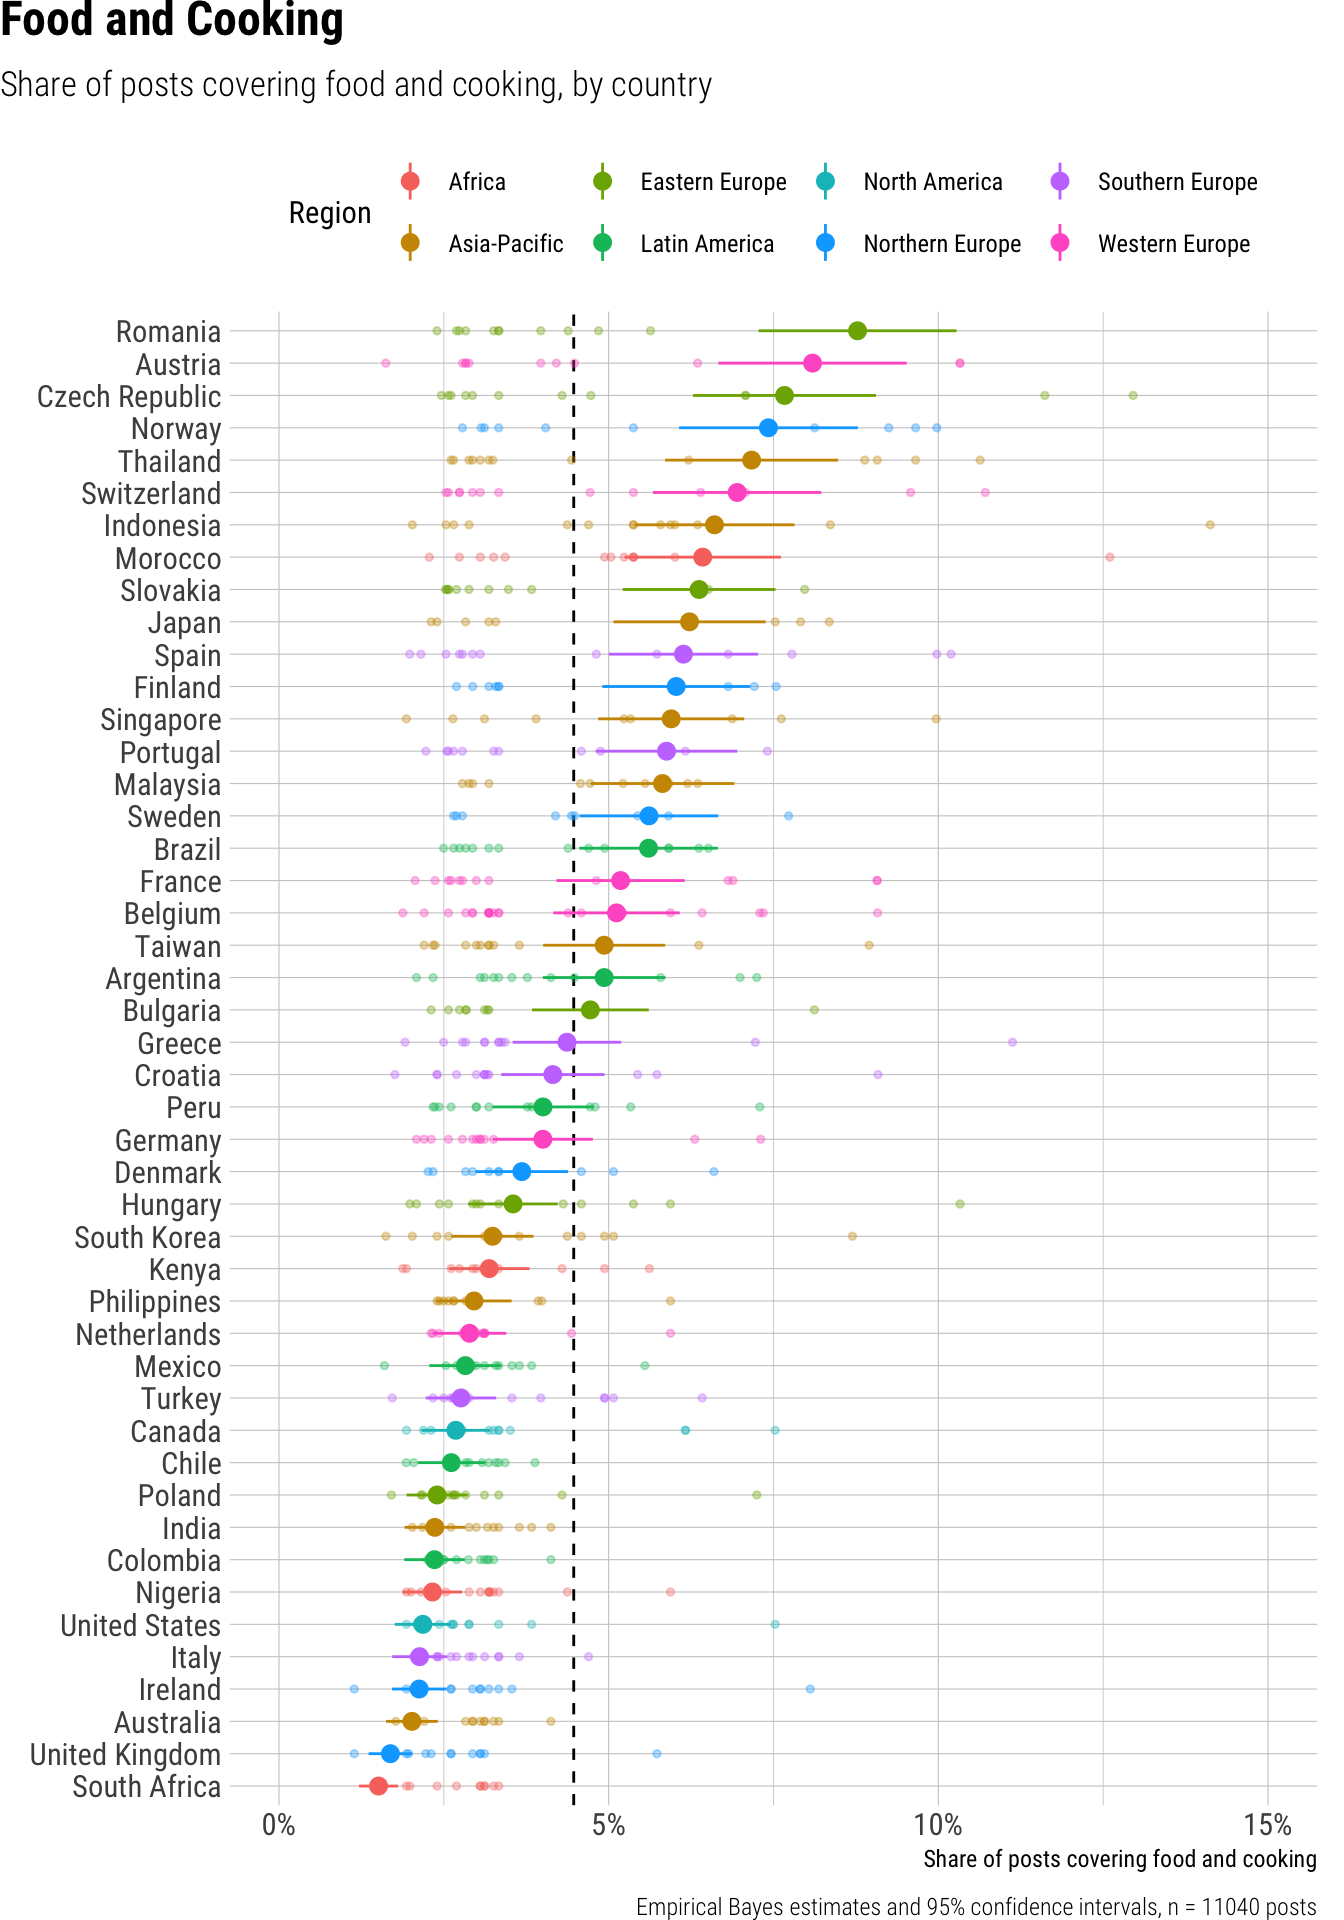
Overall, 4% of short video posts published by news outlets focused on food and cooking. While posts on TikTok were slightly higher at 5% compared to Instagram and YouTube Shorts at 4% each, these differences across platforms were small and not substantially meaningful. Similarly, among different outlet types, private broadcasters showed a slightly higher share of food and cooking content at 5% compared to other outlet types at 4%, but these differences were also small. A more substantial variation emerged when examining countries, where the share of food and cooking posts ranged from as low as 2% in countries like Australia, the United Kingdom, and the United States, to as high as 9% in Romania, with Austria and the Czech Republic also showing a notable share at 8%.
Result tables for Topic: Food
Overall average
| estimate | p.value | conf.low | conf.high |
|---|---|---|---|
| 0.04 | 0 | 0.04 | 0.05 |
Contrasts
| term | contrast | estimate | p.value | conf.low | conf.high |
|---|---|---|---|---|---|
| outlet_type | Print - Digital | 0.00 | 0.69 | -0.01 | 0.02 |
| outlet_type | Private broadcaster - Digital | 0.01 | 0.11 | 0.00 | 0.03 |
| outlet_type | Public broadcaster - Digital | 0.01 | 0.16 | -0.01 | 0.03 |
| platform | TikTok - Instagram | 0.00 | 0.36 | 0.00 | 0.01 |
| platform | YouTube Shorts - Instagram | 0.00 | 0.38 | -0.02 | 0.01 |
Predictions by platform
| platform | estimate | p.value | conf.low | conf.high |
|---|---|---|---|---|
| 0.04 | 0 | 0.03 | 0.05 | |
| TikTok | 0.05 | 0 | 0.04 | 0.06 |
| YouTube Shorts | 0.04 | 0 | 0.03 | 0.05 |
Predictions by outlet type
| outlet_type | estimate | p.value | conf.low | conf.high |
|---|---|---|---|---|
| Digital | 0.04 | 0 | 0.03 | 0.06 |
| 0.04 | 0 | 0.03 | 0.05 | |
| Private broadcaster | 0.05 | 0 | 0.04 | 0.06 |
| Public broadcaster | 0.04 | 0 | 0.03 | 0.06 |
Predictions by country
| country | estimate | p.value | conf.low | conf.high | region |
|---|---|---|---|---|---|
| Argentina | 0.05 | 0 | 0.04 | 0.06 | Latin America |
| Australia | 0.02 | 0 | 0.02 | 0.02 | Asia-Pacific |
| Austria | 0.08 | 0 | 0.07 | 0.10 | Western Europe |
| Belgium | 0.05 | 0 | 0.04 | 0.06 | Western Europe |
| Brazil | 0.06 | 0 | 0.05 | 0.07 | Latin America |
| Bulgaria | 0.05 | 0 | 0.04 | 0.06 | Eastern Europe |
| Canada | 0.03 | 0 | 0.02 | 0.03 | North America |
| Chile | 0.03 | 0 | 0.02 | 0.03 | Latin America |
| Colombia | 0.02 | 0 | 0.02 | 0.03 | Latin America |
| Croatia | 0.04 | 0 | 0.03 | 0.05 | Southern Europe |
| Czech Republic | 0.08 | 0 | 0.06 | 0.09 | Eastern Europe |
| Denmark | 0.04 | 0 | 0.03 | 0.04 | Northern Europe |
| Finland | 0.06 | 0 | 0.05 | 0.07 | Northern Europe |
| France | 0.05 | 0 | 0.04 | 0.06 | Western Europe |
| Germany | 0.04 | 0 | 0.03 | 0.05 | Western Europe |
| Greece | 0.04 | 0 | 0.04 | 0.05 | Southern Europe |
| Hungary | 0.04 | 0 | 0.03 | 0.04 | Eastern Europe |
| India | 0.02 | 0 | 0.02 | 0.03 | Asia-Pacific |
| Indonesia | 0.07 | 0 | 0.05 | 0.08 | Asia-Pacific |
| Ireland | 0.02 | 0 | 0.02 | 0.03 | Northern Europe |
| Italy | 0.02 | 0 | 0.02 | 0.03 | Southern Europe |
| Japan | 0.06 | 0 | 0.05 | 0.07 | Asia-Pacific |
| Kenya | 0.03 | 0 | 0.03 | 0.04 | Africa |
| Malaysia | 0.06 | 0 | 0.05 | 0.07 | Asia-Pacific |
| Mexico | 0.03 | 0 | 0.02 | 0.03 | Latin America |
| Morocco | 0.06 | 0 | 0.05 | 0.08 | Africa |
| Netherlands | 0.03 | 0 | 0.02 | 0.03 | Western Europe |
| Nigeria | 0.02 | 0 | 0.02 | 0.03 | Africa |
| Norway | 0.07 | 0 | 0.06 | 0.09 | Northern Europe |
| Peru | 0.04 | 0 | 0.03 | 0.05 | Latin America |
| Philippines | 0.03 | 0 | 0.02 | 0.04 | Asia-Pacific |
| Poland | 0.02 | 0 | 0.02 | 0.03 | Eastern Europe |
| Portugal | 0.06 | 0 | 0.05 | 0.07 | Southern Europe |
| Romania | 0.09 | 0 | 0.07 | 0.10 | Eastern Europe |
| Singapore | 0.06 | 0 | 0.05 | 0.07 | Asia-Pacific |
| Slovakia | 0.06 | 0 | 0.05 | 0.08 | Eastern Europe |
| South Africa | 0.02 | 0 | 0.01 | 0.02 | Africa |
| South Korea | 0.03 | 0 | 0.03 | 0.04 | Asia-Pacific |
| Spain | 0.06 | 0 | 0.05 | 0.07 | Southern Europe |
| Sweden | 0.06 | 0 | 0.05 | 0.07 | Northern Europe |
| Switzerland | 0.07 | 0 | 0.06 | 0.08 | Western Europe |
| Taiwan | 0.05 | 0 | 0.04 | 0.06 | Asia-Pacific |
| Thailand | 0.07 | 0 | 0.06 | 0.08 | Asia-Pacific |
| Turkey | 0.03 | 0 | 0.02 | 0.03 | Southern Europe |
| United Kingdom | 0.02 | 0 | 0.01 | 0.02 | Northern Europe |
| United States | 0.02 | 0 | 0.02 | 0.03 | North America |
Pets and Animals
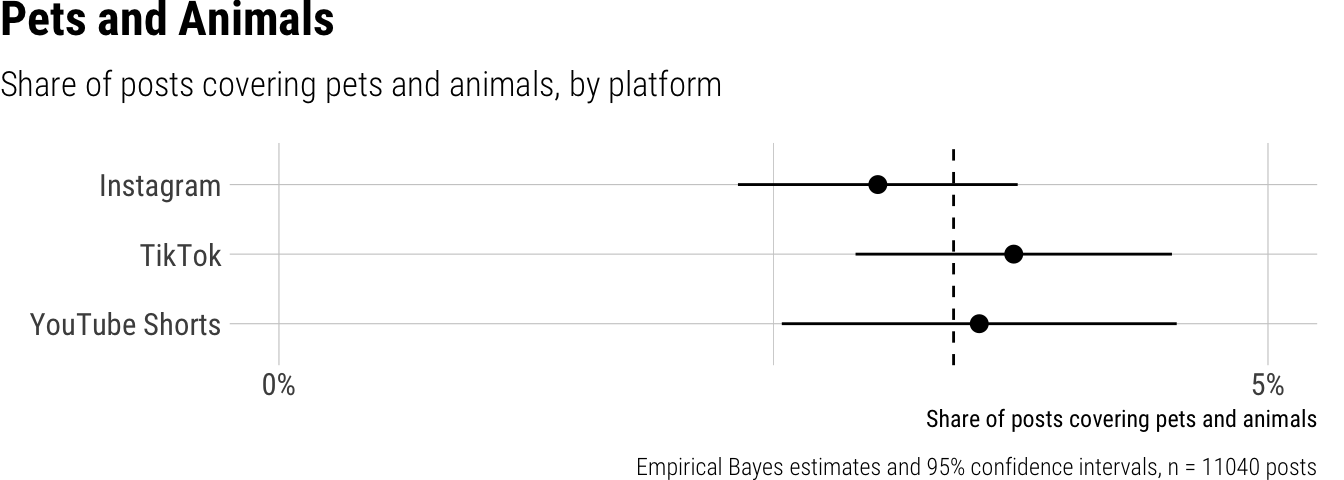
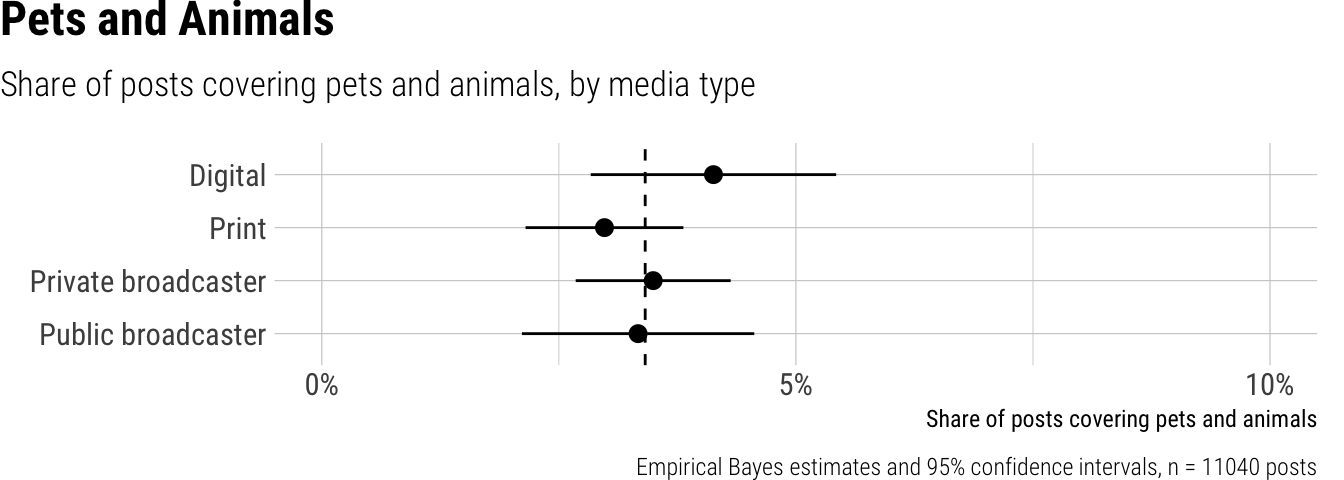
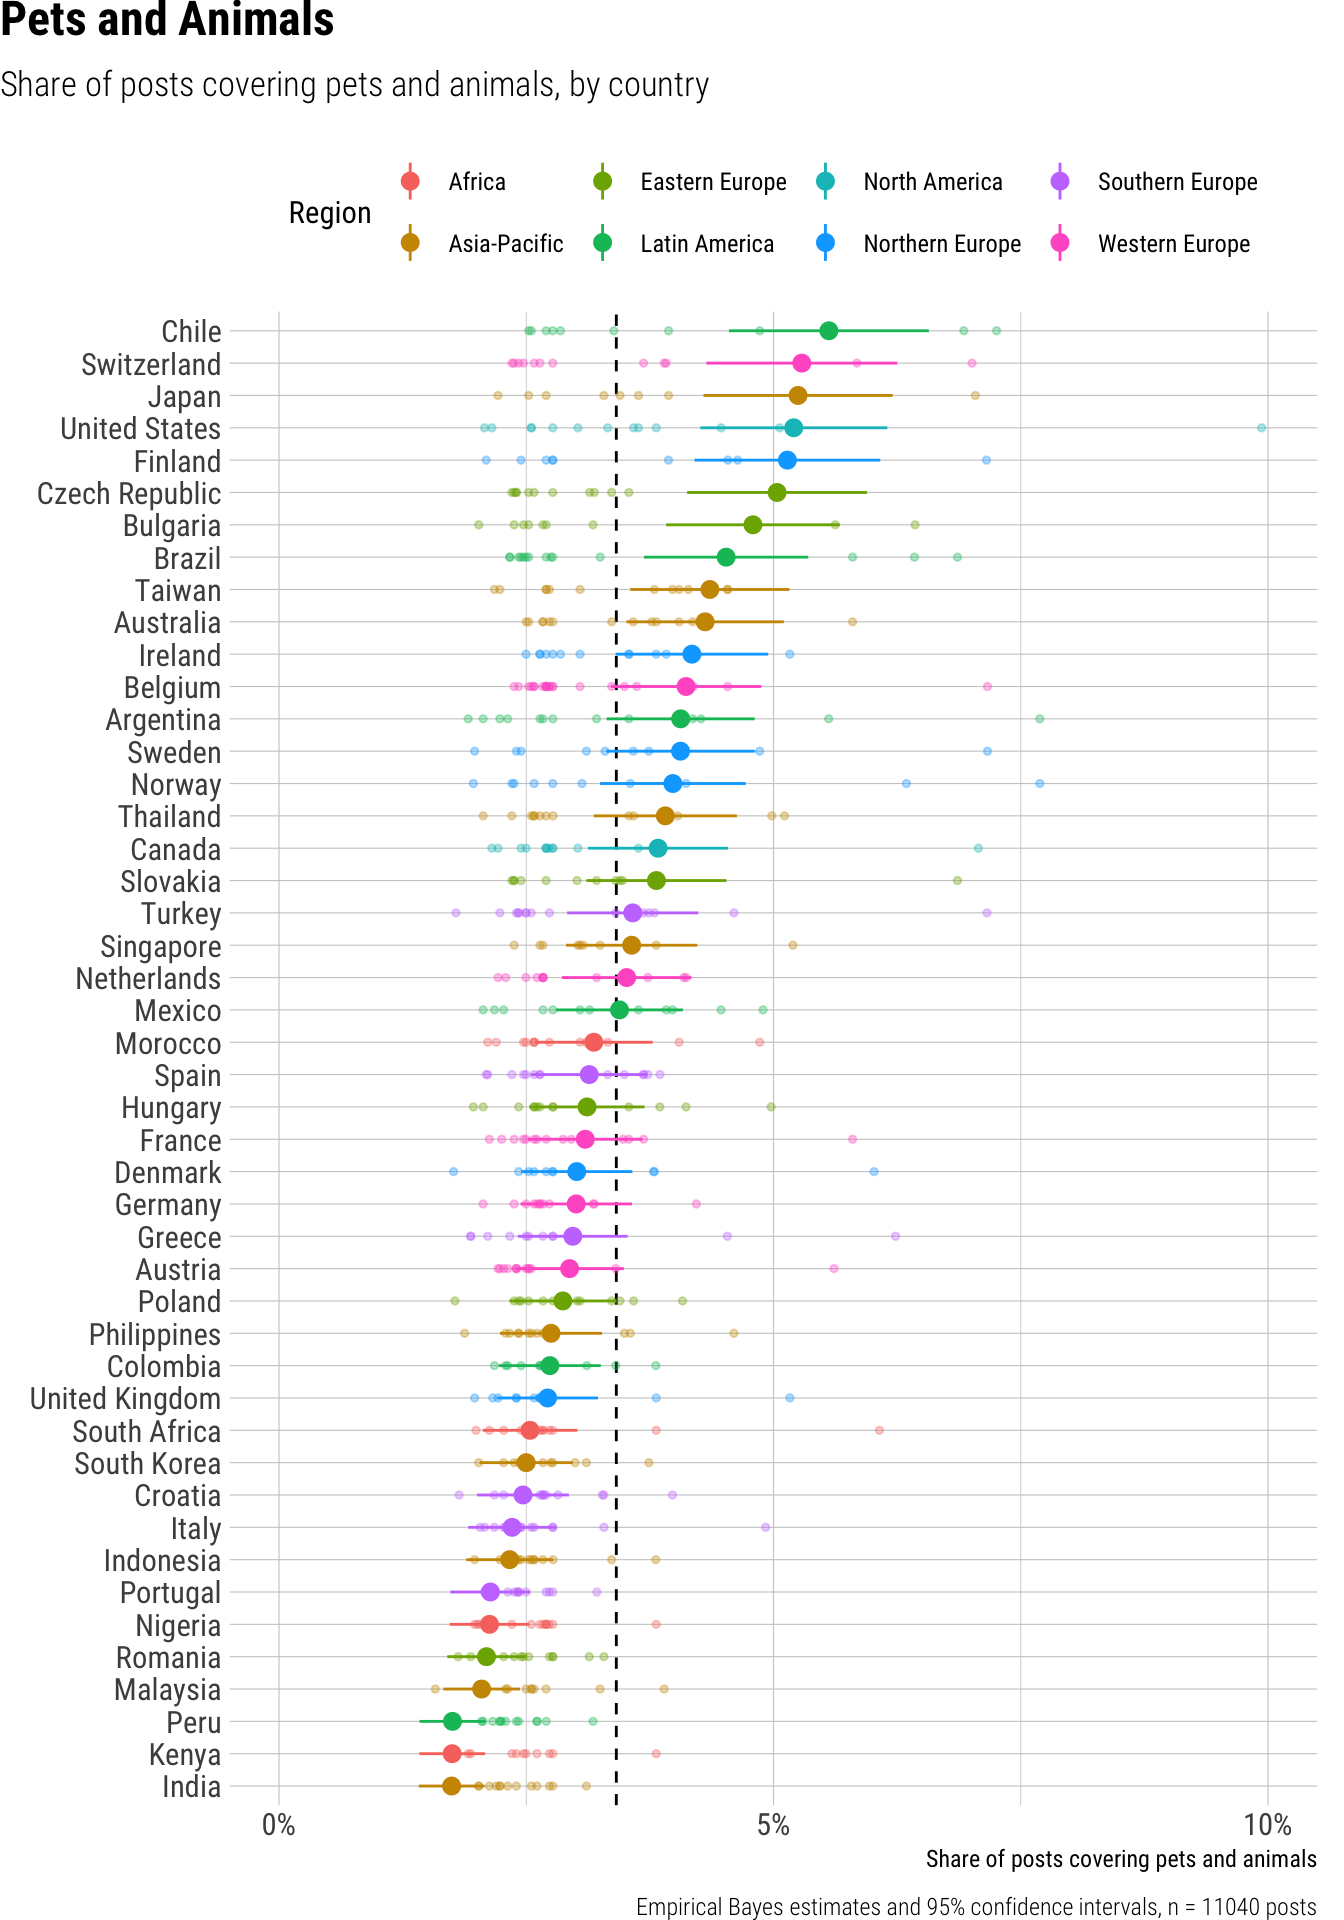
Across all short video posts published by news outlets, pets and animals appeared in an average of 3% of content. When examining differences by platform, TikTok and YouTube Shorts each dedicated 4% of their posts to pets and animals, a slightly higher proportion compared to Instagram at 3%. Differences across outlet types were also modest, with digital news outlets featuring pets and animals in 4% of their short videos, slightly more than print media, private broadcasters, and public broadcasters, which all posted about the topic in 3% of their content. However, the share of posts covering pets and animals varied more substantially by country, ranging from lows of 2% in nations like India, Italy, and Kenya to highs of 6% in Chile, and 5% in countries such as Brazil, Japan, and the United States.
Result tables for Topic: Pets
Overall average
| estimate | p.value | conf.low | conf.high |
|---|---|---|---|
| 0.03 | 0 | 0.03 | 0.04 |
Contrasts
| term | contrast | estimate | p.value | conf.low | conf.high |
|---|---|---|---|---|---|
| outlet_type | Print - Digital | -0.01 | 0.05 | -0.03 | 0.00 |
| outlet_type | Private broadcaster - Digital | -0.01 | 0.25 | -0.02 | 0.01 |
| outlet_type | Public broadcaster - Digital | -0.01 | 0.21 | -0.03 | 0.01 |
| platform | TikTok - Instagram | 0.01 | 0.10 | 0.00 | 0.01 |
| platform | YouTube Shorts - Instagram | 0.00 | 0.41 | -0.01 | 0.01 |
Predictions by platform
| platform | estimate | p.value | conf.low | conf.high |
|---|---|---|---|---|
| 0.03 | 0 | 0.02 | 0.04 | |
| TikTok | 0.04 | 0 | 0.03 | 0.05 |
| YouTube Shorts | 0.04 | 0 | 0.03 | 0.05 |
Predictions by outlet type
| outlet_type | estimate | p.value | conf.low | conf.high |
|---|---|---|---|---|
| Digital | 0.04 | 0 | 0.03 | 0.05 |
| 0.03 | 0 | 0.02 | 0.04 | |
| Private broadcaster | 0.03 | 0 | 0.03 | 0.04 |
| Public broadcaster | 0.03 | 0 | 0.02 | 0.05 |
Predictions by country
| country | estimate | p.value | conf.low | conf.high | region |
|---|---|---|---|---|---|
| Argentina | 0.04 | 0 | 0.03 | 0.05 | Latin America |
| Australia | 0.04 | 0 | 0.04 | 0.05 | Asia-Pacific |
| Austria | 0.03 | 0 | 0.02 | 0.03 | Western Europe |
| Belgium | 0.04 | 0 | 0.03 | 0.05 | Western Europe |
| Brazil | 0.05 | 0 | 0.04 | 0.05 | Latin America |
| Bulgaria | 0.05 | 0 | 0.04 | 0.06 | Eastern Europe |
| Canada | 0.04 | 0 | 0.03 | 0.05 | North America |
| Chile | 0.06 | 0 | 0.05 | 0.07 | Latin America |
| Colombia | 0.03 | 0 | 0.02 | 0.03 | Latin America |
| Croatia | 0.02 | 0 | 0.02 | 0.03 | Southern Europe |
| Czech Republic | 0.05 | 0 | 0.04 | 0.06 | Eastern Europe |
| Denmark | 0.03 | 0 | 0.02 | 0.04 | Northern Europe |
| Finland | 0.05 | 0 | 0.04 | 0.06 | Northern Europe |
| France | 0.03 | 0 | 0.03 | 0.04 | Western Europe |
| Germany | 0.03 | 0 | 0.02 | 0.04 | Western Europe |
| Greece | 0.03 | 0 | 0.02 | 0.04 | Southern Europe |
| Hungary | 0.03 | 0 | 0.03 | 0.04 | Eastern Europe |
| India | 0.02 | 0 | 0.01 | 0.02 | Asia-Pacific |
| Indonesia | 0.02 | 0 | 0.02 | 0.03 | Asia-Pacific |
| Ireland | 0.04 | 0 | 0.03 | 0.05 | Northern Europe |
| Italy | 0.02 | 0 | 0.02 | 0.03 | Southern Europe |
| Japan | 0.05 | 0 | 0.04 | 0.06 | Asia-Pacific |
| Kenya | 0.02 | 0 | 0.01 | 0.02 | Africa |
| Malaysia | 0.02 | 0 | 0.02 | 0.02 | Asia-Pacific |
| Mexico | 0.03 | 0 | 0.03 | 0.04 | Latin America |
| Morocco | 0.03 | 0 | 0.03 | 0.04 | Africa |
| Netherlands | 0.04 | 0 | 0.03 | 0.04 | Western Europe |
| Nigeria | 0.02 | 0 | 0.02 | 0.03 | Africa |
| Norway | 0.04 | 0 | 0.03 | 0.05 | Northern Europe |
| Peru | 0.02 | 0 | 0.01 | 0.02 | Latin America |
| Philippines | 0.03 | 0 | 0.02 | 0.03 | Asia-Pacific |
| Poland | 0.03 | 0 | 0.02 | 0.03 | Eastern Europe |
| Portugal | 0.02 | 0 | 0.02 | 0.03 | Southern Europe |
| Romania | 0.02 | 0 | 0.02 | 0.02 | Eastern Europe |
| Singapore | 0.04 | 0 | 0.03 | 0.04 | Asia-Pacific |
| Slovakia | 0.04 | 0 | 0.03 | 0.05 | Eastern Europe |
| South Africa | 0.03 | 0 | 0.02 | 0.03 | Africa |
| South Korea | 0.02 | 0 | 0.02 | 0.03 | Asia-Pacific |
| Spain | 0.03 | 0 | 0.03 | 0.04 | Southern Europe |
| Sweden | 0.04 | 0 | 0.03 | 0.05 | Northern Europe |
| Switzerland | 0.05 | 0 | 0.04 | 0.06 | Western Europe |
| Taiwan | 0.04 | 0 | 0.04 | 0.05 | Asia-Pacific |
| Thailand | 0.04 | 0 | 0.03 | 0.05 | Asia-Pacific |
| Turkey | 0.04 | 0 | 0.03 | 0.04 | Southern Europe |
| United Kingdom | 0.03 | 0 | 0.02 | 0.03 | Northern Europe |
| United States | 0.05 | 0 | 0.04 | 0.06 | North America |
Entertainment News and Industry
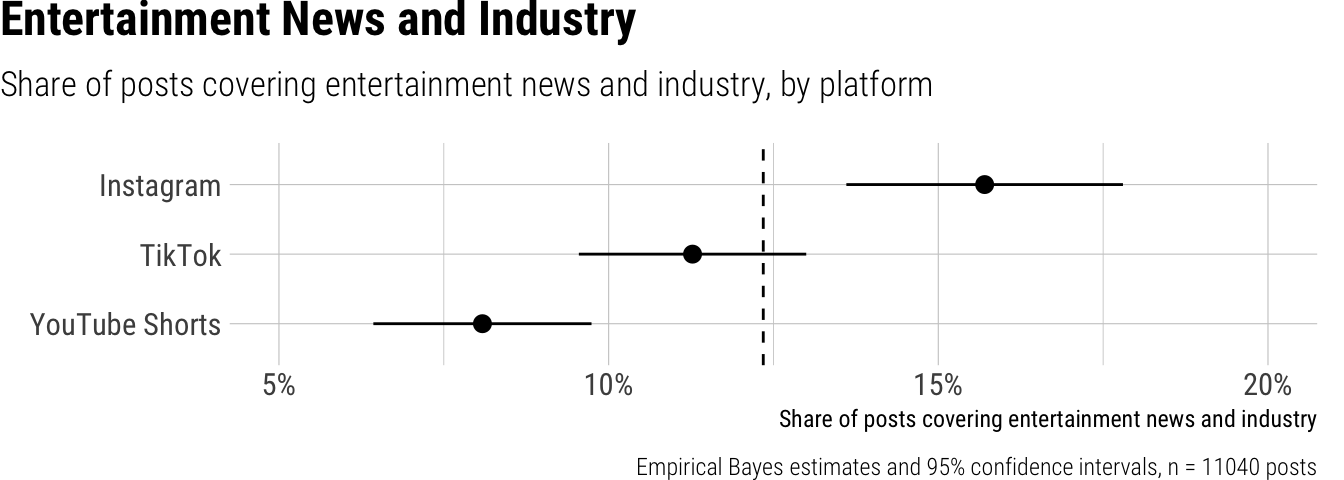
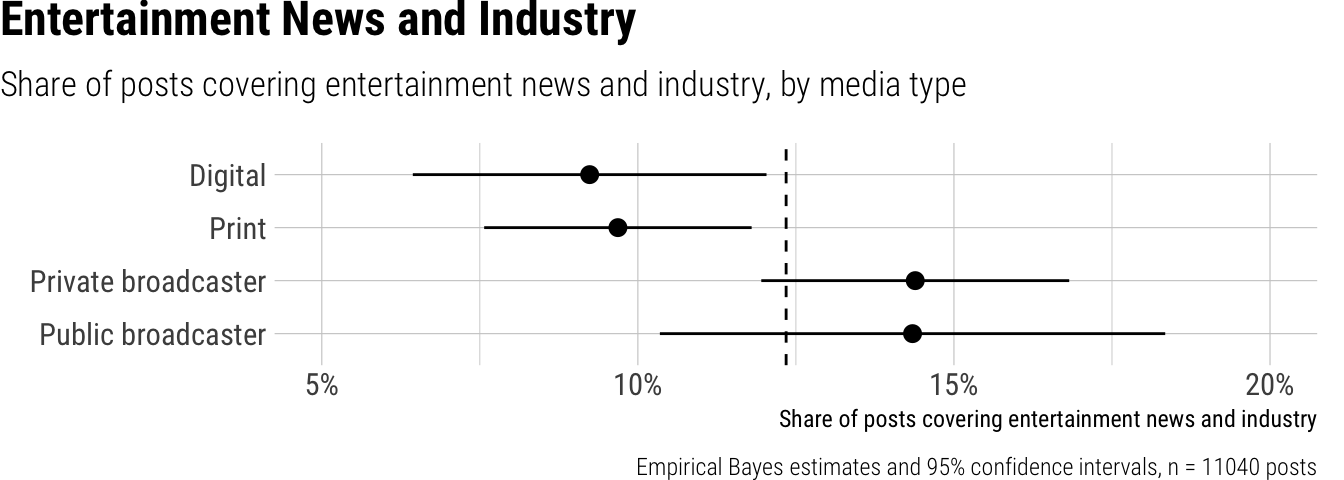
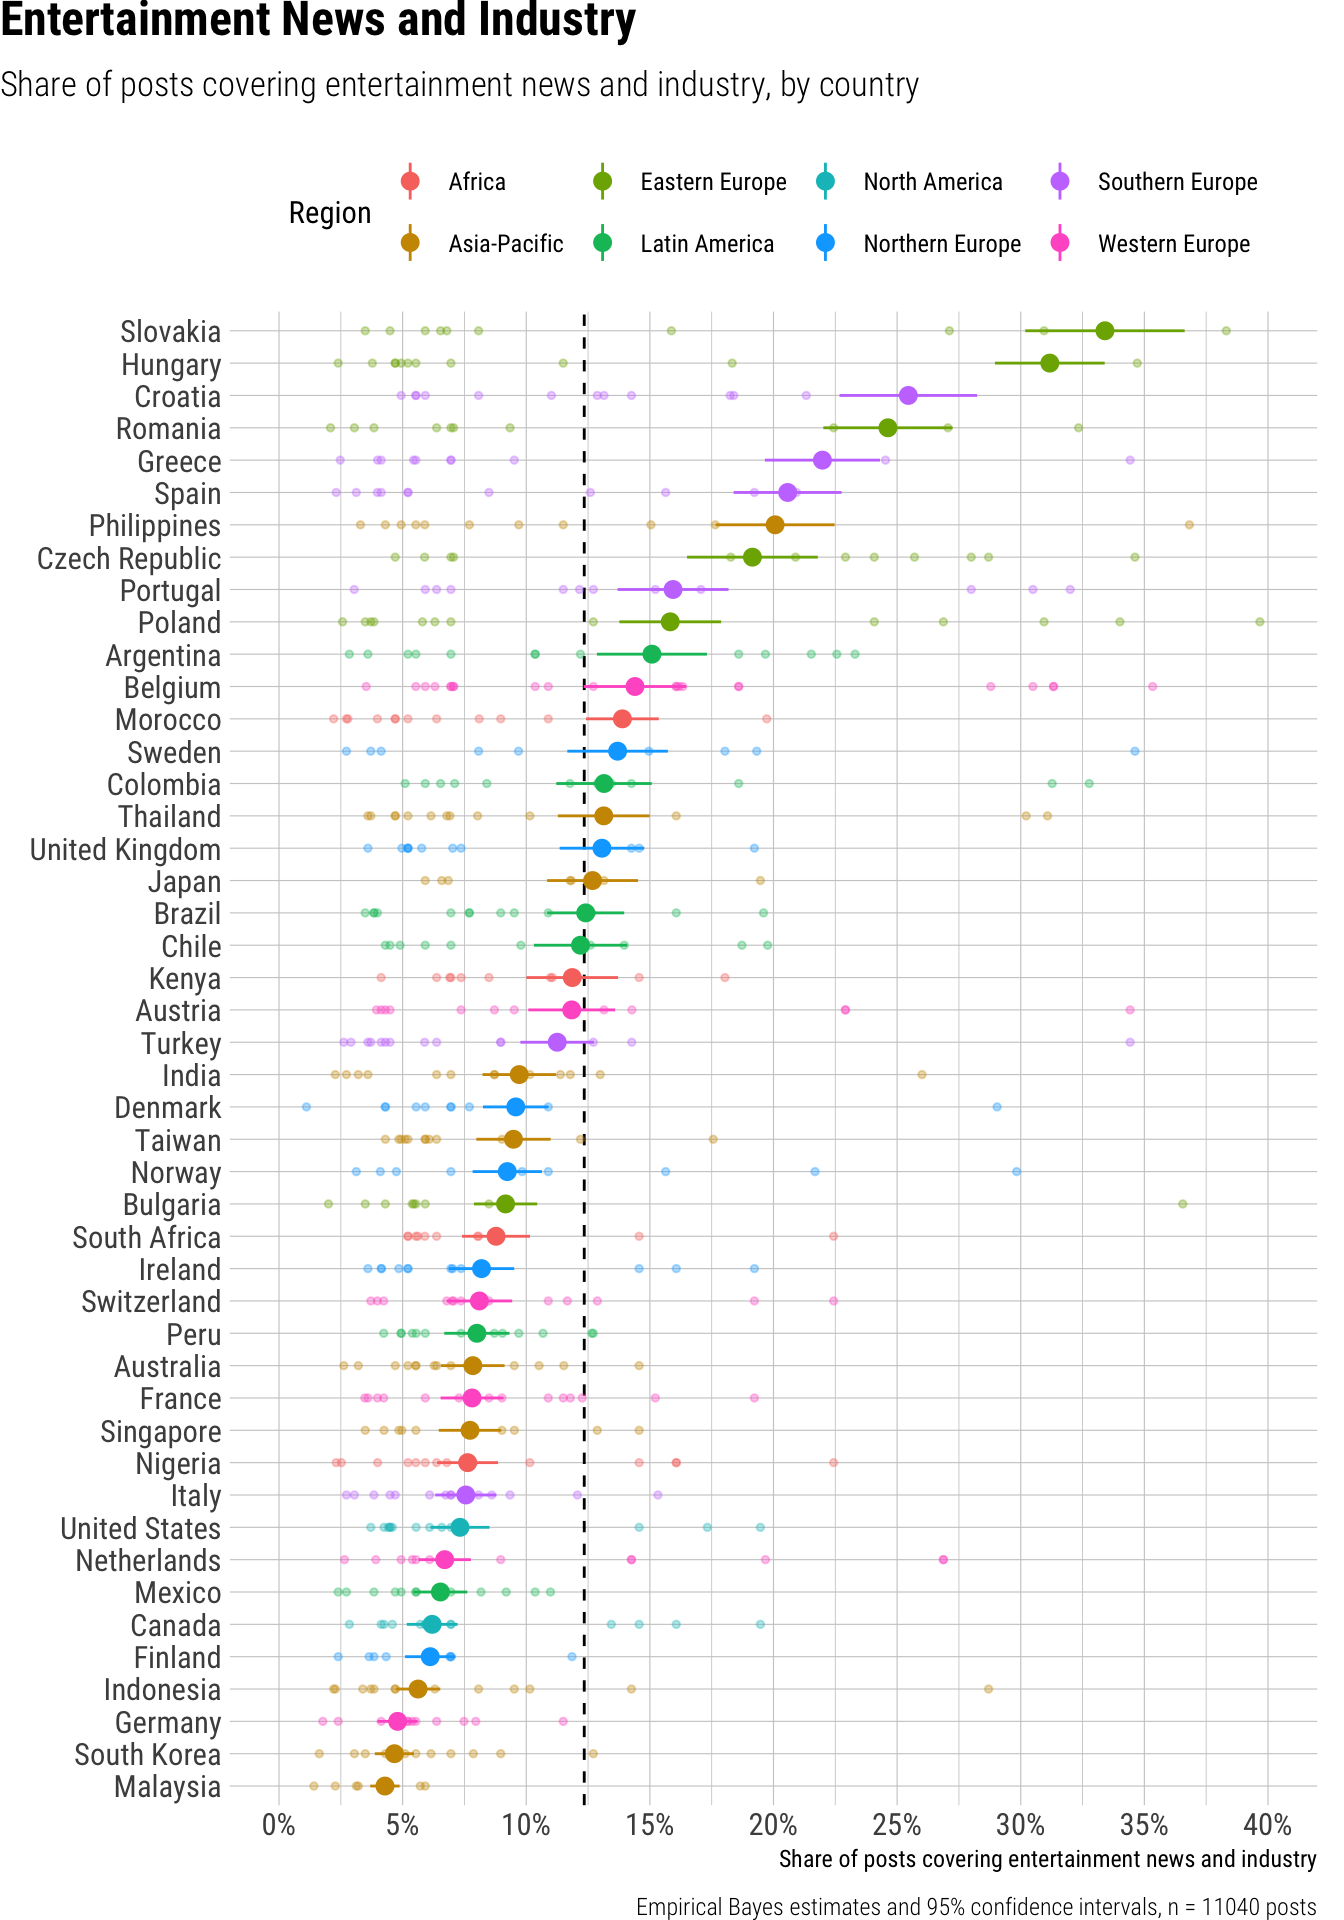
News outlets globally dedicated an average of 12% of their short video posts to entertainment news and industry. This share varied significantly by platform; short videos on Instagram dedicated the largest proportion to entertainment at 16%, while TikTok posts had a smaller share at 11%, and YouTube Shorts significantly less again at 8%. Differences by outlet type were also observed; public broadcasters, for instance, devoted a significantly larger share (at 14%) to entertainment compared to digital-native outlets (at 9%). Private broadcasters also showed a similar pattern at 14%, while print outlets were at 10%. The proportion of entertainment content varied widely across countries, ranging from a low of 4% in Malaysia to a high of 33% in Slovakia. Other countries with high engagement included Hungary (31%), Croatia and Romania (both 25%), Greece (22%), and Spain (21%), while Germany (5%), Canada (6%), Finland (6%), and Indonesia (6%) showed some of the lowest shares.
Result tables for Topic: Entertainment
Overall average
| estimate | p.value | conf.low | conf.high |
|---|---|---|---|
| 0.12 | 0 | 0.11 | 0.14 |
Contrasts
| term | contrast | estimate | p.value | conf.low | conf.high |
|---|---|---|---|---|---|
| outlet_type | Print - Digital | 0.00 | 0.89 | -0.03 | 0.04 |
| outlet_type | Private broadcaster - Digital | 0.03 | 0.09 | 0.00 | 0.06 |
| outlet_type | Public broadcaster - Digital | 0.05 | 0.04 | 0.00 | 0.10 |
| platform | TikTok - Instagram | -0.03 | 0.00 | -0.05 | -0.02 |
| platform | YouTube Shorts - Instagram | -0.06 | 0.00 | -0.07 | -0.04 |
Predictions by platform
| platform | estimate | p.value | conf.low | conf.high |
|---|---|---|---|---|
| 0.16 | 0 | 0.14 | 0.18 | |
| TikTok | 0.11 | 0 | 0.10 | 0.13 |
| YouTube Shorts | 0.08 | 0 | 0.06 | 0.10 |
Predictions by outlet type
| outlet_type | estimate | p.value | conf.low | conf.high |
|---|---|---|---|---|
| Digital | 0.09 | 0 | 0.06 | 0.12 |
| 0.10 | 0 | 0.08 | 0.12 | |
| Private broadcaster | 0.14 | 0 | 0.12 | 0.17 |
| Public broadcaster | 0.14 | 0 | 0.10 | 0.18 |
Predictions by country
| country | estimate | p.value | conf.low | conf.high | region |
|---|---|---|---|---|---|
| Argentina | 0.15 | 0 | 0.13 | 0.17 | Latin America |
| Australia | 0.08 | 0 | 0.07 | 0.09 | Asia-Pacific |
| Austria | 0.12 | 0 | 0.10 | 0.14 | Western Europe |
| Belgium | 0.14 | 0 | 0.12 | 0.16 | Western Europe |
| Brazil | 0.12 | 0 | 0.11 | 0.14 | Latin America |
| Bulgaria | 0.09 | 0 | 0.08 | 0.10 | Eastern Europe |
| Canada | 0.06 | 0 | 0.05 | 0.07 | North America |
| Chile | 0.12 | 0 | 0.10 | 0.14 | Latin America |
| Colombia | 0.13 | 0 | 0.11 | 0.15 | Latin America |
| Croatia | 0.25 | 0 | 0.23 | 0.28 | Southern Europe |
| Czech Republic | 0.19 | 0 | 0.17 | 0.22 | Eastern Europe |
| Denmark | 0.10 | 0 | 0.08 | 0.11 | Northern Europe |
| Finland | 0.06 | 0 | 0.05 | 0.07 | Northern Europe |
| France | 0.08 | 0 | 0.07 | 0.09 | Western Europe |
| Germany | 0.05 | 0 | 0.04 | 0.06 | Western Europe |
| Greece | 0.22 | 0 | 0.20 | 0.24 | Southern Europe |
| Hungary | 0.31 | 0 | 0.29 | 0.33 | Eastern Europe |
| India | 0.10 | 0 | 0.08 | 0.11 | Asia-Pacific |
| Indonesia | 0.06 | 0 | 0.05 | 0.07 | Asia-Pacific |
| Ireland | 0.08 | 0 | 0.07 | 0.10 | Northern Europe |
| Italy | 0.08 | 0 | 0.06 | 0.09 | Southern Europe |
| Japan | 0.13 | 0 | 0.11 | 0.15 | Asia-Pacific |
| Kenya | 0.12 | 0 | 0.10 | 0.14 | Africa |
| Malaysia | 0.04 | 0 | 0.04 | 0.05 | Asia-Pacific |
| Mexico | 0.07 | 0 | 0.05 | 0.08 | Latin America |
| Morocco | 0.14 | 0 | 0.12 | 0.15 | Africa |
| Netherlands | 0.07 | 0 | 0.06 | 0.08 | Western Europe |
| Nigeria | 0.08 | 0 | 0.06 | 0.09 | Africa |
| Norway | 0.09 | 0 | 0.08 | 0.11 | Northern Europe |
| Peru | 0.08 | 0 | 0.07 | 0.09 | Latin America |
| Philippines | 0.20 | 0 | 0.18 | 0.22 | Asia-Pacific |
| Poland | 0.16 | 0 | 0.14 | 0.18 | Eastern Europe |
| Portugal | 0.16 | 0 | 0.14 | 0.18 | Southern Europe |
| Romania | 0.25 | 0 | 0.22 | 0.27 | Eastern Europe |
| Singapore | 0.08 | 0 | 0.06 | 0.09 | Asia-Pacific |
| Slovakia | 0.33 | 0 | 0.30 | 0.37 | Eastern Europe |
| South Africa | 0.09 | 0 | 0.07 | 0.10 | Africa |
| South Korea | 0.05 | 0 | 0.04 | 0.05 | Asia-Pacific |
| Spain | 0.21 | 0 | 0.18 | 0.23 | Southern Europe |
| Sweden | 0.14 | 0 | 0.12 | 0.16 | Northern Europe |
| Switzerland | 0.08 | 0 | 0.07 | 0.09 | Western Europe |
| Taiwan | 0.09 | 0 | 0.08 | 0.11 | Asia-Pacific |
| Thailand | 0.13 | 0 | 0.11 | 0.15 | Asia-Pacific |
| Turkey | 0.11 | 0 | 0.10 | 0.13 | Southern Europe |
| United Kingdom | 0.13 | 0 | 0.11 | 0.15 | Northern Europe |
| United States | 0.07 | 0 | 0.06 | 0.09 | North America |
Celebrity and Royalty
News outlets on various platforms globally devoted approximately 10% of their short video posts to celebrity and royalty coverage. When examining platform differences, Instagram featured a slightly higher share of this content, with 11% of its posts on the topic, compared to 9% on TikTok and 8% on YouTube Shorts, representing significant differences of 2 and 3 percentage points respectively relative to Instagram. Outlet type also played a role; digital outlets posted the highest share at 12%, followed closely by print outlets at 11%, and private broadcasters at 9%. Public broadcasters, however, significantly covered less celebrity and royalty content, with only 6% of their posts, marking a 6 percentage point difference compared to digital outlets. Across countries, the share of celebrity and royalty coverage varied considerably, ranging from a low of 4% in countries like Germany and Greece to a high of 17% in Hungary and the United Kingdom.
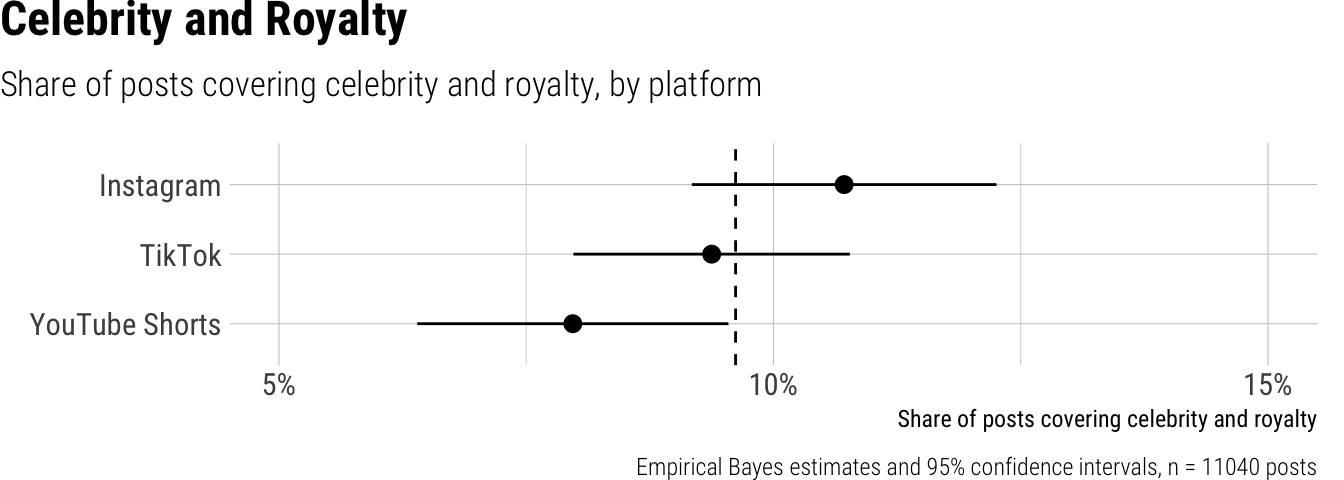
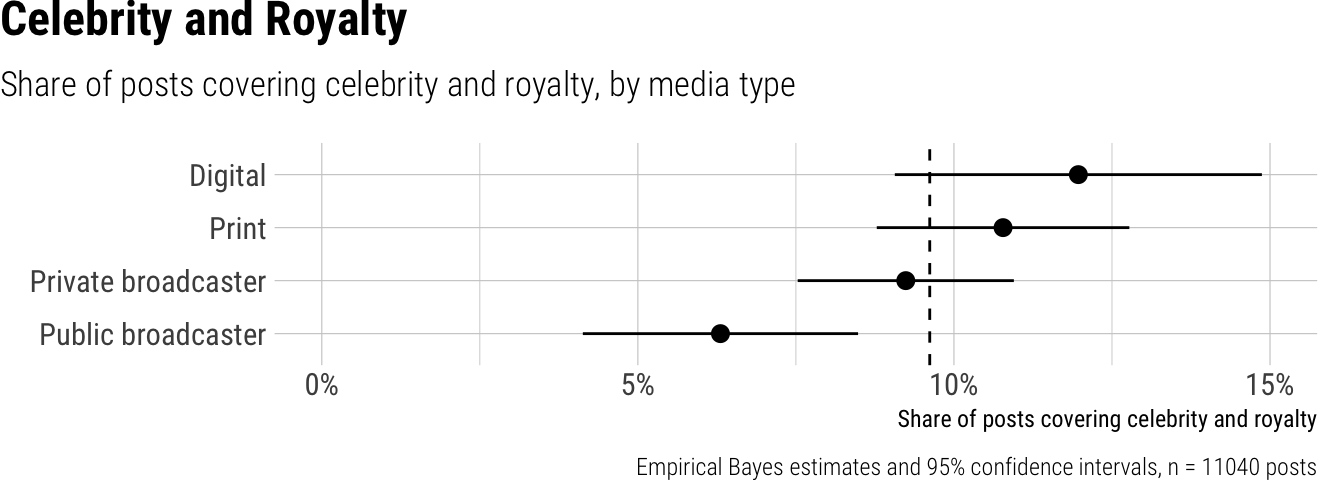
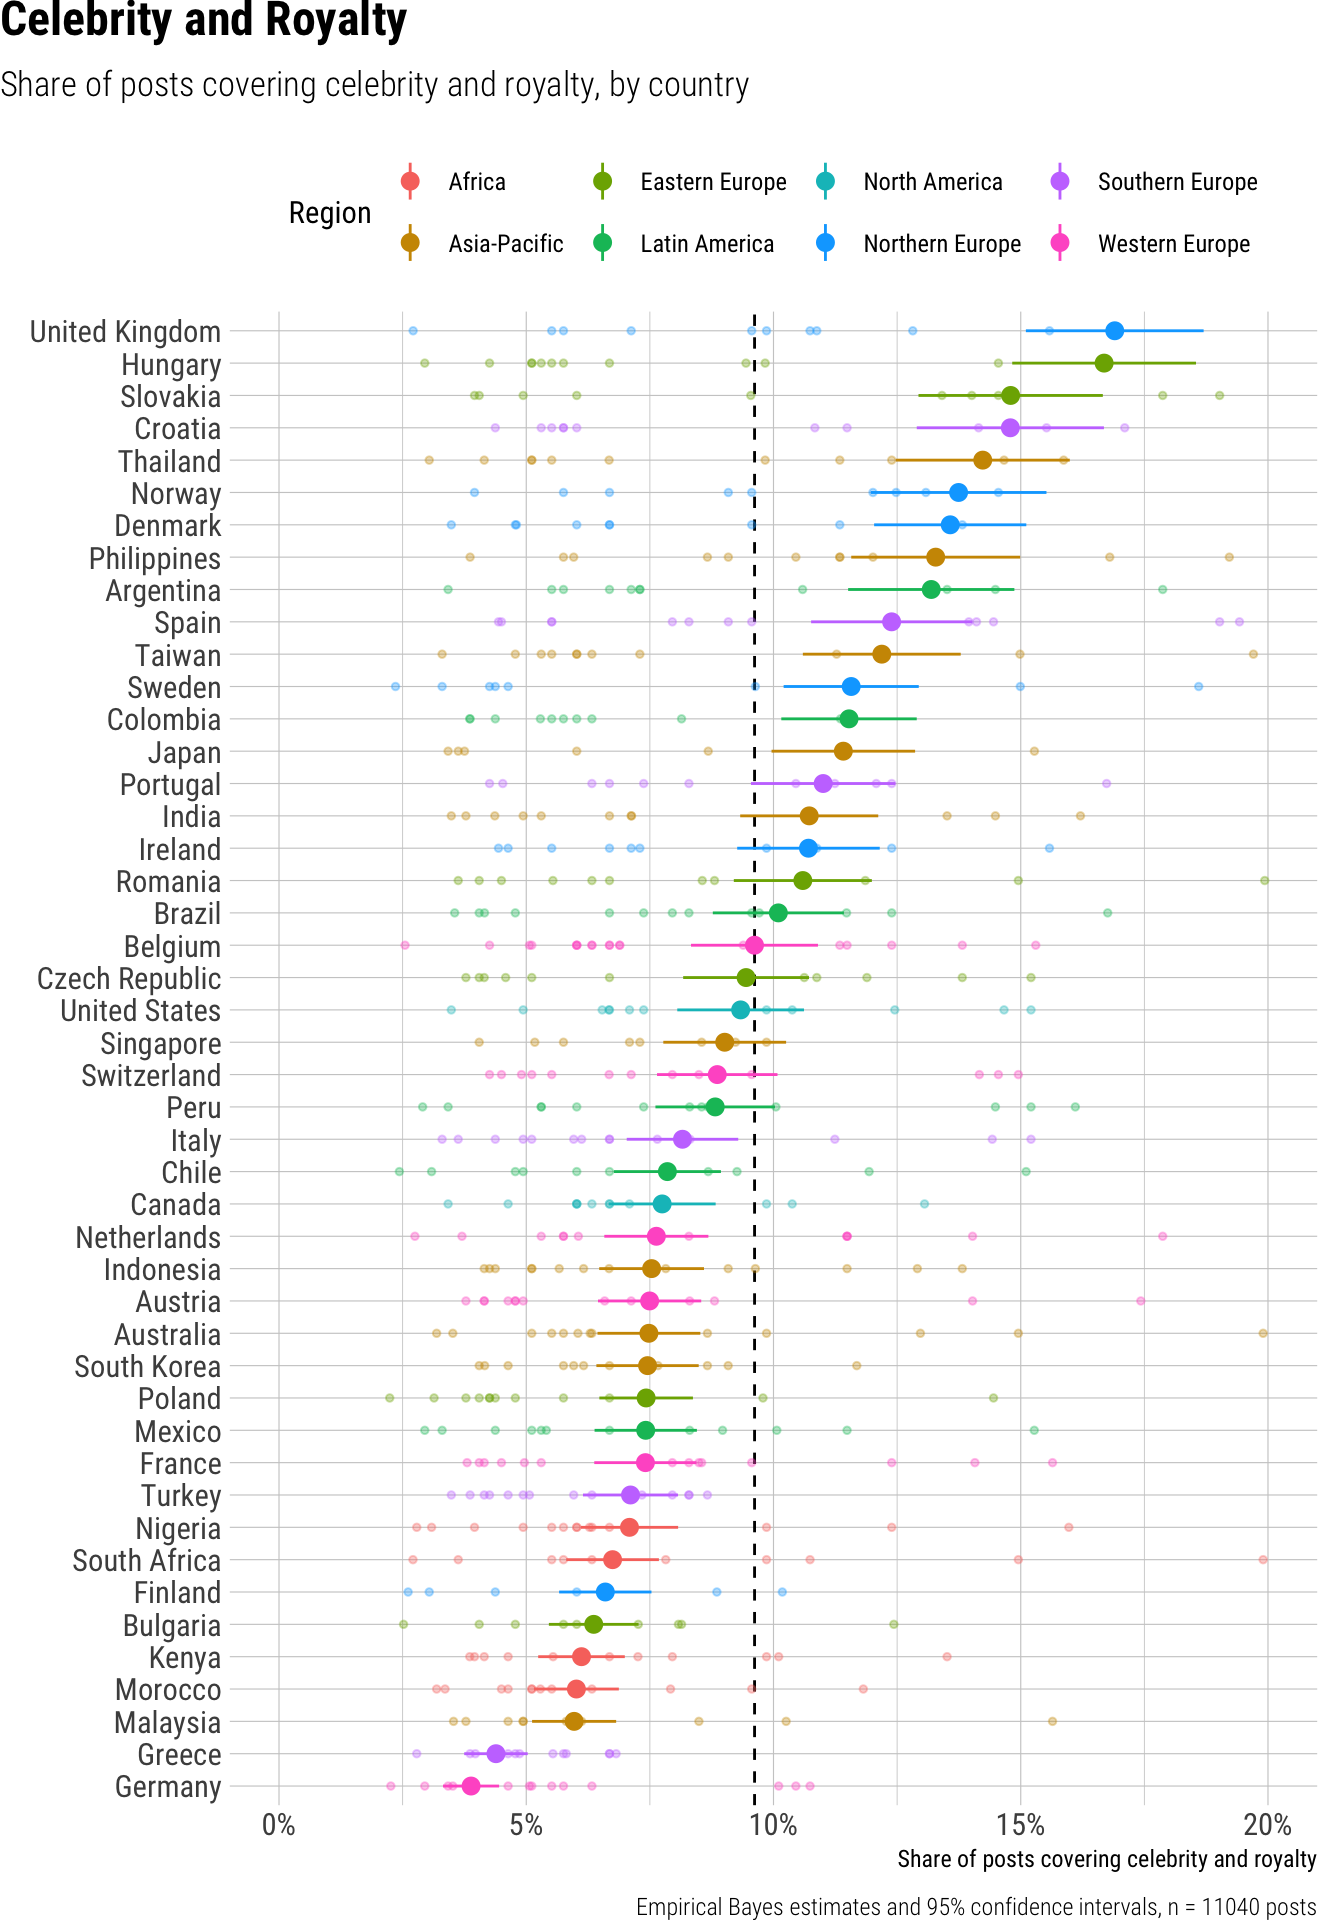
Result tables for Topic: Celebrity
Overall average
| estimate | p.value | conf.low | conf.high |
|---|---|---|---|
| 0.1 | 0 | 0.08 | 0.11 |
Contrasts
| term | contrast | estimate | p.value | conf.low | conf.high |
|---|---|---|---|---|---|
| outlet_type | Print - Digital | -0.02 | 0.30 | -0.05 | 0.02 |
| outlet_type | Private broadcaster - Digital | -0.03 | 0.06 | -0.06 | 0.00 |
| outlet_type | Public broadcaster - Digital | -0.06 | 0.00 | -0.10 | -0.03 |
| platform | TikTok - Instagram | -0.02 | 0.01 | -0.03 | 0.00 |
| platform | YouTube Shorts - Instagram | -0.03 | 0.00 | -0.05 | -0.01 |
Predictions by platform
| platform | estimate | p.value | conf.low | conf.high |
|---|---|---|---|---|
| 0.11 | 0 | 0.09 | 0.12 | |
| TikTok | 0.09 | 0 | 0.08 | 0.11 |
| YouTube Shorts | 0.08 | 0 | 0.06 | 0.10 |
Predictions by outlet type
| outlet_type | estimate | p.value | conf.low | conf.high |
|---|---|---|---|---|
| Digital | 0.12 | 0 | 0.09 | 0.15 |
| 0.11 | 0 | 0.09 | 0.13 | |
| Private broadcaster | 0.09 | 0 | 0.08 | 0.11 |
| Public broadcaster | 0.06 | 0 | 0.04 | 0.08 |
Predictions by country
| country | estimate | p.value | conf.low | conf.high | region |
|---|---|---|---|---|---|
| Argentina | 0.13 | 0 | 0.12 | 0.15 | Latin America |
| Australia | 0.07 | 0 | 0.06 | 0.09 | Asia-Pacific |
| Austria | 0.07 | 0 | 0.06 | 0.09 | Western Europe |
| Belgium | 0.10 | 0 | 0.08 | 0.11 | Western Europe |
| Brazil | 0.10 | 0 | 0.09 | 0.11 | Latin America |
| Bulgaria | 0.06 | 0 | 0.05 | 0.07 | Eastern Europe |
| Canada | 0.08 | 0 | 0.07 | 0.09 | North America |
| Chile | 0.08 | 0 | 0.07 | 0.09 | Latin America |
| Colombia | 0.12 | 0 | 0.10 | 0.13 | Latin America |
| Croatia | 0.15 | 0 | 0.13 | 0.17 | Southern Europe |
| Czech Republic | 0.09 | 0 | 0.08 | 0.11 | Eastern Europe |
| Denmark | 0.14 | 0 | 0.12 | 0.15 | Northern Europe |
| Finland | 0.07 | 0 | 0.06 | 0.08 | Northern Europe |
| France | 0.07 | 0 | 0.06 | 0.08 | Western Europe |
| Germany | 0.04 | 0 | 0.03 | 0.04 | Western Europe |
| Greece | 0.04 | 0 | 0.04 | 0.05 | Southern Europe |
| Hungary | 0.17 | 0 | 0.15 | 0.19 | Eastern Europe |
| India | 0.11 | 0 | 0.09 | 0.12 | Asia-Pacific |
| Indonesia | 0.08 | 0 | 0.06 | 0.09 | Asia-Pacific |
| Ireland | 0.11 | 0 | 0.09 | 0.12 | Northern Europe |
| Italy | 0.08 | 0 | 0.07 | 0.09 | Southern Europe |
| Japan | 0.11 | 0 | 0.10 | 0.13 | Asia-Pacific |
| Kenya | 0.06 | 0 | 0.05 | 0.07 | Africa |
| Malaysia | 0.06 | 0 | 0.05 | 0.07 | Asia-Pacific |
| Mexico | 0.07 | 0 | 0.06 | 0.08 | Latin America |
| Morocco | 0.06 | 0 | 0.05 | 0.07 | Africa |
| Netherlands | 0.08 | 0 | 0.07 | 0.09 | Western Europe |
| Nigeria | 0.07 | 0 | 0.06 | 0.08 | Africa |
| Norway | 0.14 | 0 | 0.12 | 0.16 | Northern Europe |
| Peru | 0.09 | 0 | 0.08 | 0.10 | Latin America |
| Philippines | 0.13 | 0 | 0.12 | 0.15 | Asia-Pacific |
| Poland | 0.07 | 0 | 0.06 | 0.08 | Eastern Europe |
| Portugal | 0.11 | 0 | 0.10 | 0.12 | Southern Europe |
| Romania | 0.11 | 0 | 0.09 | 0.12 | Eastern Europe |
| Singapore | 0.09 | 0 | 0.08 | 0.10 | Asia-Pacific |
| Slovakia | 0.15 | 0 | 0.13 | 0.17 | Eastern Europe |
| South Africa | 0.07 | 0 | 0.06 | 0.08 | Africa |
| South Korea | 0.07 | 0 | 0.06 | 0.08 | Asia-Pacific |
| Spain | 0.12 | 0 | 0.11 | 0.14 | Southern Europe |
| Sweden | 0.12 | 0 | 0.10 | 0.13 | Northern Europe |
| Switzerland | 0.09 | 0 | 0.08 | 0.10 | Western Europe |
| Taiwan | 0.12 | 0 | 0.11 | 0.14 | Asia-Pacific |
| Thailand | 0.14 | 0 | 0.12 | 0.16 | Asia-Pacific |
| Turkey | 0.07 | 0 | 0.06 | 0.08 | Southern Europe |
| United Kingdom | 0.17 | 0 | 0.15 | 0.19 | Northern Europe |
| United States | 0.09 | 0 | 0.08 | 0.11 | North America |
Sports
On average, 6% of news outlets’ short video posts covered sports. Analyzing platform differences, we observed a statistically significant contrast, with Instagram posts featuring sports significantly more often at 8% compared to TikTok at 5%, while YouTube Shorts fell in the middle at 6%. Differences across outlet types were small and not statistically significant; digital outlets posted sports content in 8% of their short videos, followed by print and private broadcasters at 6%, and public broadcasters at 5%. We noted considerable variation in sports coverage across countries, ranging from a low of 3% in countries like Poland, Denmark, and Malaysia, to a high of 12% in Colombia and 11% in Chile and Croatia.
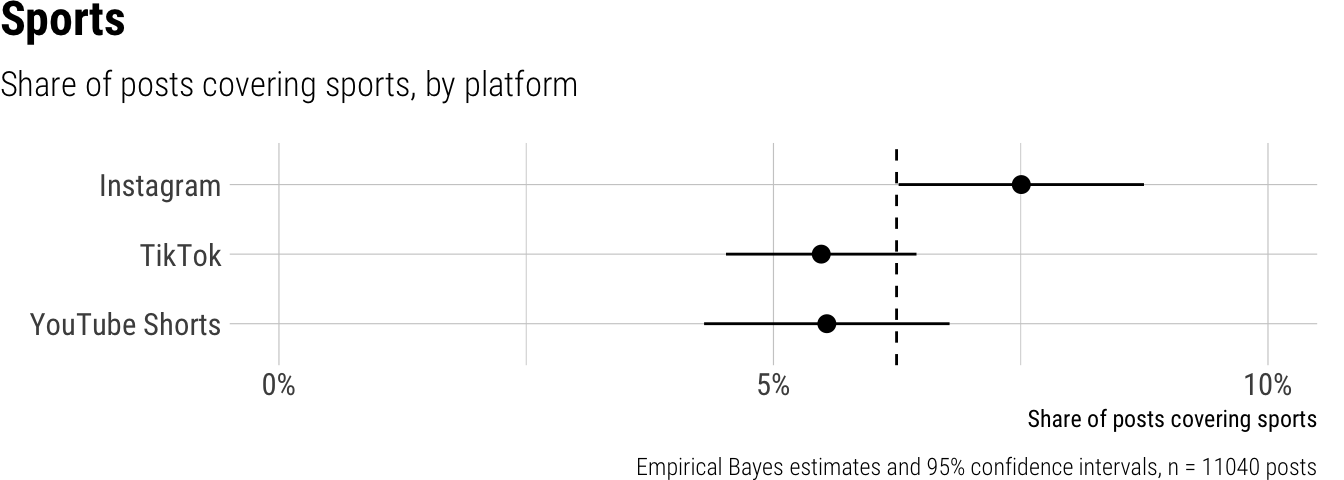
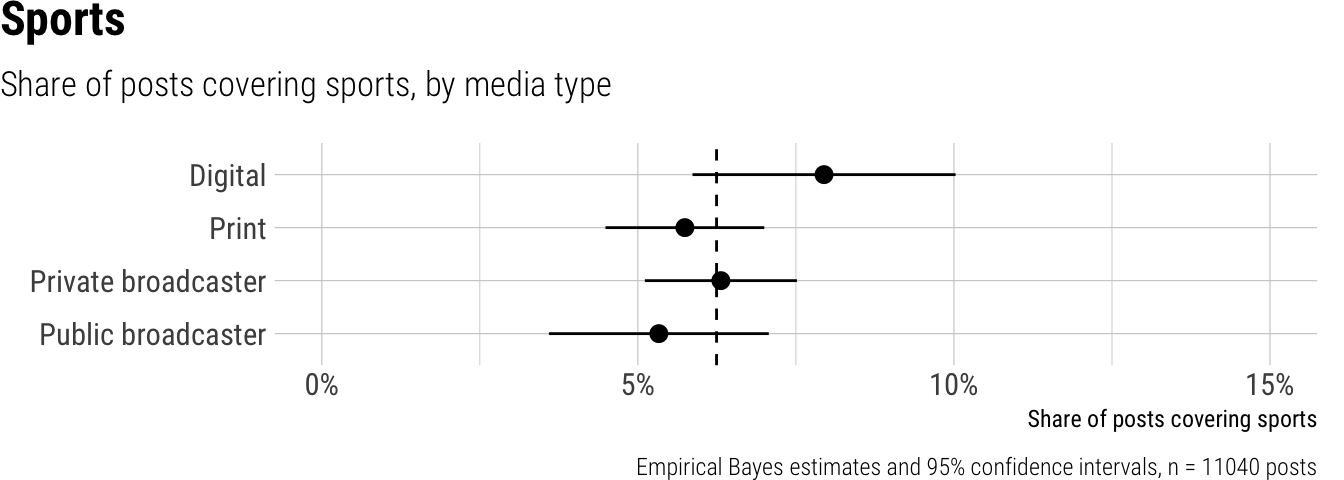
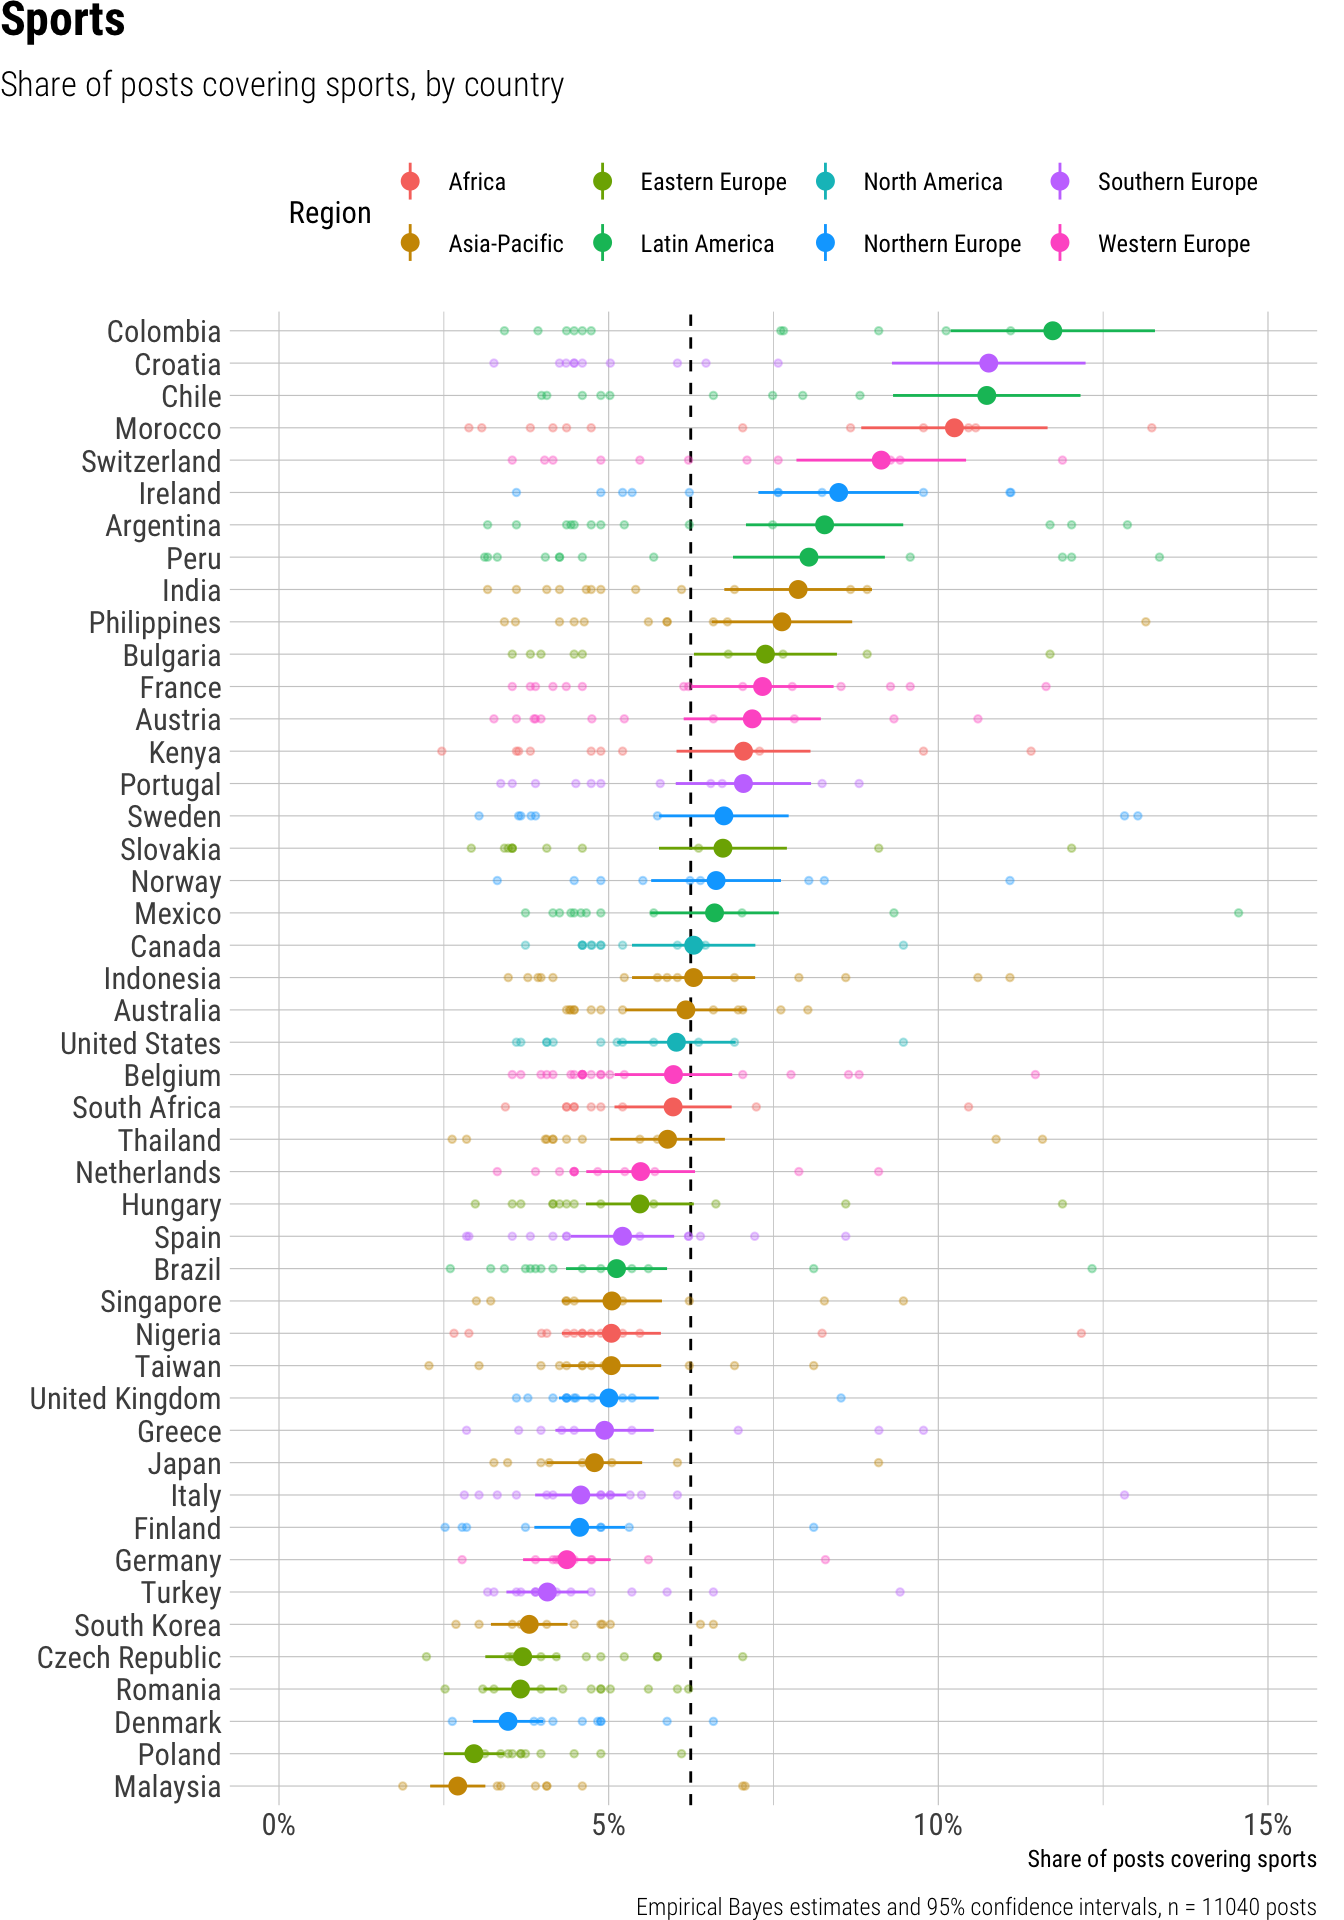
Result tables for Topic: Sports
Overall average
| estimate | p.value | conf.low | conf.high |
|---|---|---|---|
| 0.06 | 0 | 0.05 | 0.07 |
Contrasts
| term | contrast | estimate | p.value | conf.low | conf.high |
|---|---|---|---|---|---|
| outlet_type | Print - Digital | -0.02 | 0.10 | -0.04 | 0.00 |
| outlet_type | Private broadcaster - Digital | -0.01 | 0.26 | -0.03 | 0.01 |
| outlet_type | Public broadcaster - Digital | -0.02 | 0.06 | -0.05 | 0.00 |
| platform | TikTok - Instagram | -0.02 | 0.00 | -0.03 | -0.01 |
| platform | YouTube Shorts - Instagram | -0.01 | 0.05 | -0.03 | 0.00 |
Predictions by platform
| platform | estimate | p.value | conf.low | conf.high |
|---|---|---|---|---|
| 0.08 | 0 | 0.06 | 0.09 | |
| TikTok | 0.05 | 0 | 0.05 | 0.06 |
| YouTube Shorts | 0.06 | 0 | 0.04 | 0.07 |
Predictions by outlet type
| outlet_type | estimate | p.value | conf.low | conf.high |
|---|---|---|---|---|
| Digital | 0.08 | 0 | 0.06 | 0.10 |
| 0.06 | 0 | 0.04 | 0.07 | |
| Private broadcaster | 0.06 | 0 | 0.05 | 0.08 |
| Public broadcaster | 0.05 | 0 | 0.04 | 0.07 |
Predictions by country
| country | estimate | p.value | conf.low | conf.high | region |
|---|---|---|---|---|---|
| Argentina | 0.08 | 0 | 0.07 | 0.09 | Latin America |
| Australia | 0.06 | 0 | 0.05 | 0.07 | Asia-Pacific |
| Austria | 0.07 | 0 | 0.06 | 0.08 | Western Europe |
| Belgium | 0.06 | 0 | 0.05 | 0.07 | Western Europe |
| Brazil | 0.05 | 0 | 0.04 | 0.06 | Latin America |
| Bulgaria | 0.07 | 0 | 0.06 | 0.08 | Eastern Europe |
| Canada | 0.06 | 0 | 0.05 | 0.07 | North America |
| Chile | 0.11 | 0 | 0.09 | 0.12 | Latin America |
| Colombia | 0.12 | 0 | 0.10 | 0.13 | Latin America |
| Croatia | 0.11 | 0 | 0.09 | 0.12 | Southern Europe |
| Czech Republic | 0.04 | 0 | 0.03 | 0.04 | Eastern Europe |
| Denmark | 0.03 | 0 | 0.03 | 0.04 | Northern Europe |
| Finland | 0.05 | 0 | 0.04 | 0.05 | Northern Europe |
| France | 0.07 | 0 | 0.06 | 0.08 | Western Europe |
| Germany | 0.04 | 0 | 0.04 | 0.05 | Western Europe |
| Greece | 0.05 | 0 | 0.04 | 0.06 | Southern Europe |
| Hungary | 0.05 | 0 | 0.05 | 0.06 | Eastern Europe |
| India | 0.08 | 0 | 0.07 | 0.09 | Asia-Pacific |
| Indonesia | 0.06 | 0 | 0.05 | 0.07 | Asia-Pacific |
| Ireland | 0.08 | 0 | 0.07 | 0.10 | Northern Europe |
| Italy | 0.05 | 0 | 0.04 | 0.05 | Southern Europe |
| Japan | 0.05 | 0 | 0.04 | 0.06 | Asia-Pacific |
| Kenya | 0.07 | 0 | 0.06 | 0.08 | Africa |
| Malaysia | 0.03 | 0 | 0.02 | 0.03 | Asia-Pacific |
| Mexico | 0.07 | 0 | 0.06 | 0.08 | Latin America |
| Morocco | 0.10 | 0 | 0.09 | 0.12 | Africa |
| Netherlands | 0.05 | 0 | 0.05 | 0.06 | Western Europe |
| Nigeria | 0.05 | 0 | 0.04 | 0.06 | Africa |
| Norway | 0.07 | 0 | 0.06 | 0.08 | Northern Europe |
| Peru | 0.08 | 0 | 0.07 | 0.09 | Latin America |
| Philippines | 0.08 | 0 | 0.07 | 0.09 | Asia-Pacific |
| Poland | 0.03 | 0 | 0.03 | 0.03 | Eastern Europe |
| Portugal | 0.07 | 0 | 0.06 | 0.08 | Southern Europe |
| Romania | 0.04 | 0 | 0.03 | 0.04 | Eastern Europe |
| Singapore | 0.05 | 0 | 0.04 | 0.06 | Asia-Pacific |
| Slovakia | 0.07 | 0 | 0.06 | 0.08 | Eastern Europe |
| South Africa | 0.06 | 0 | 0.05 | 0.07 | Africa |
| South Korea | 0.04 | 0 | 0.03 | 0.04 | Asia-Pacific |
| Spain | 0.05 | 0 | 0.04 | 0.06 | Southern Europe |
| Sweden | 0.07 | 0 | 0.06 | 0.08 | Northern Europe |
| Switzerland | 0.09 | 0 | 0.08 | 0.10 | Western Europe |
| Taiwan | 0.05 | 0 | 0.04 | 0.06 | Asia-Pacific |
| Thailand | 0.06 | 0 | 0.05 | 0.07 | Asia-Pacific |
| Turkey | 0.04 | 0 | 0.03 | 0.05 | Southern Europe |
| United Kingdom | 0.05 | 0 | 0.04 | 0.06 | Northern Europe |
| United States | 0.06 | 0 | 0.05 | 0.07 | North America |
Promotion and Advertisements
We observed that promotion and advertisements accounted for an average of 5% of short video posts published by news outlets. This share varied significantly across platforms, with Instagram posts containing promotional content 9% of the time, substantially more than TikTok at 3% and YouTube Shorts at 2%. Differences across outlet types were statistically significant but small, with digital outlets posting promotional content slightly more often at 6%, compared to print, private broadcasters, and public broadcasters, which ranged from 4% to 5%. We also noted substantial country-level variations, with the share of promotional posts ranging from as low as 1% in the United Kingdom to as high as 18% in Slovakia, alongside other high figures such as 12% in Croatia and Thailand.
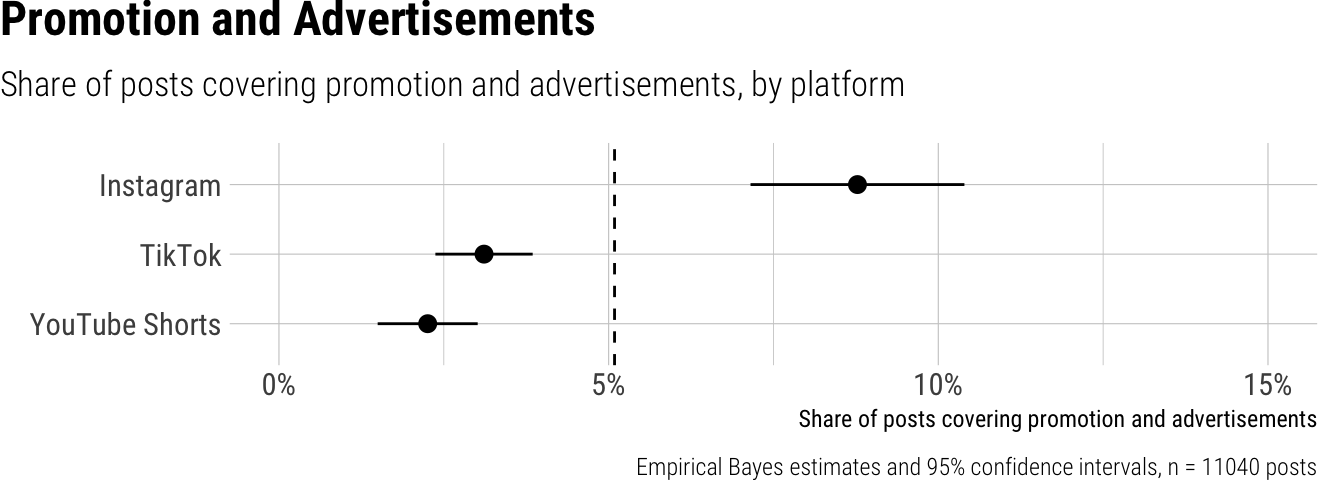
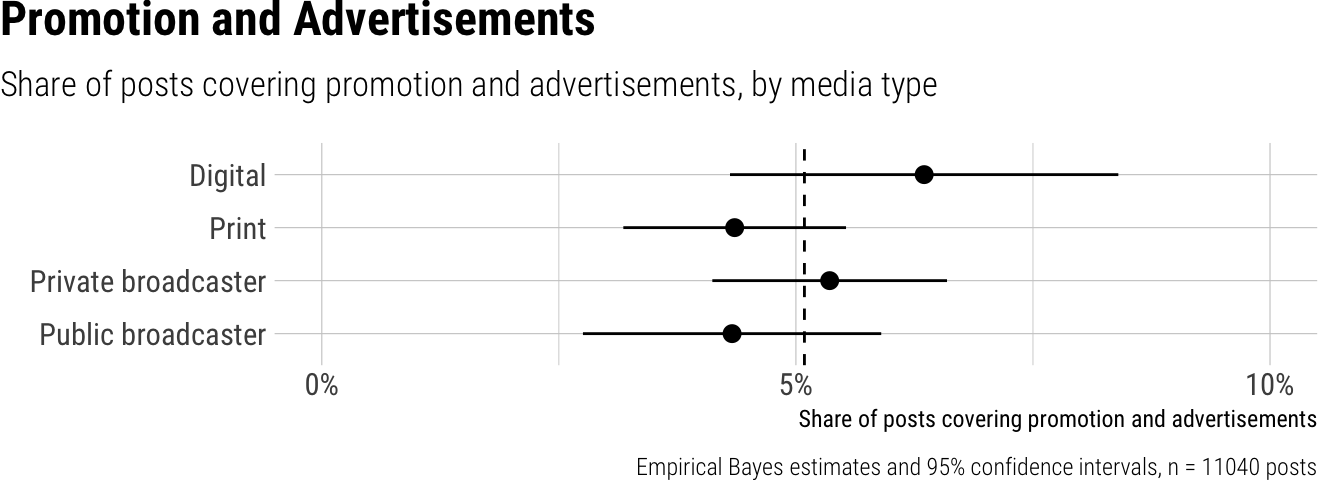
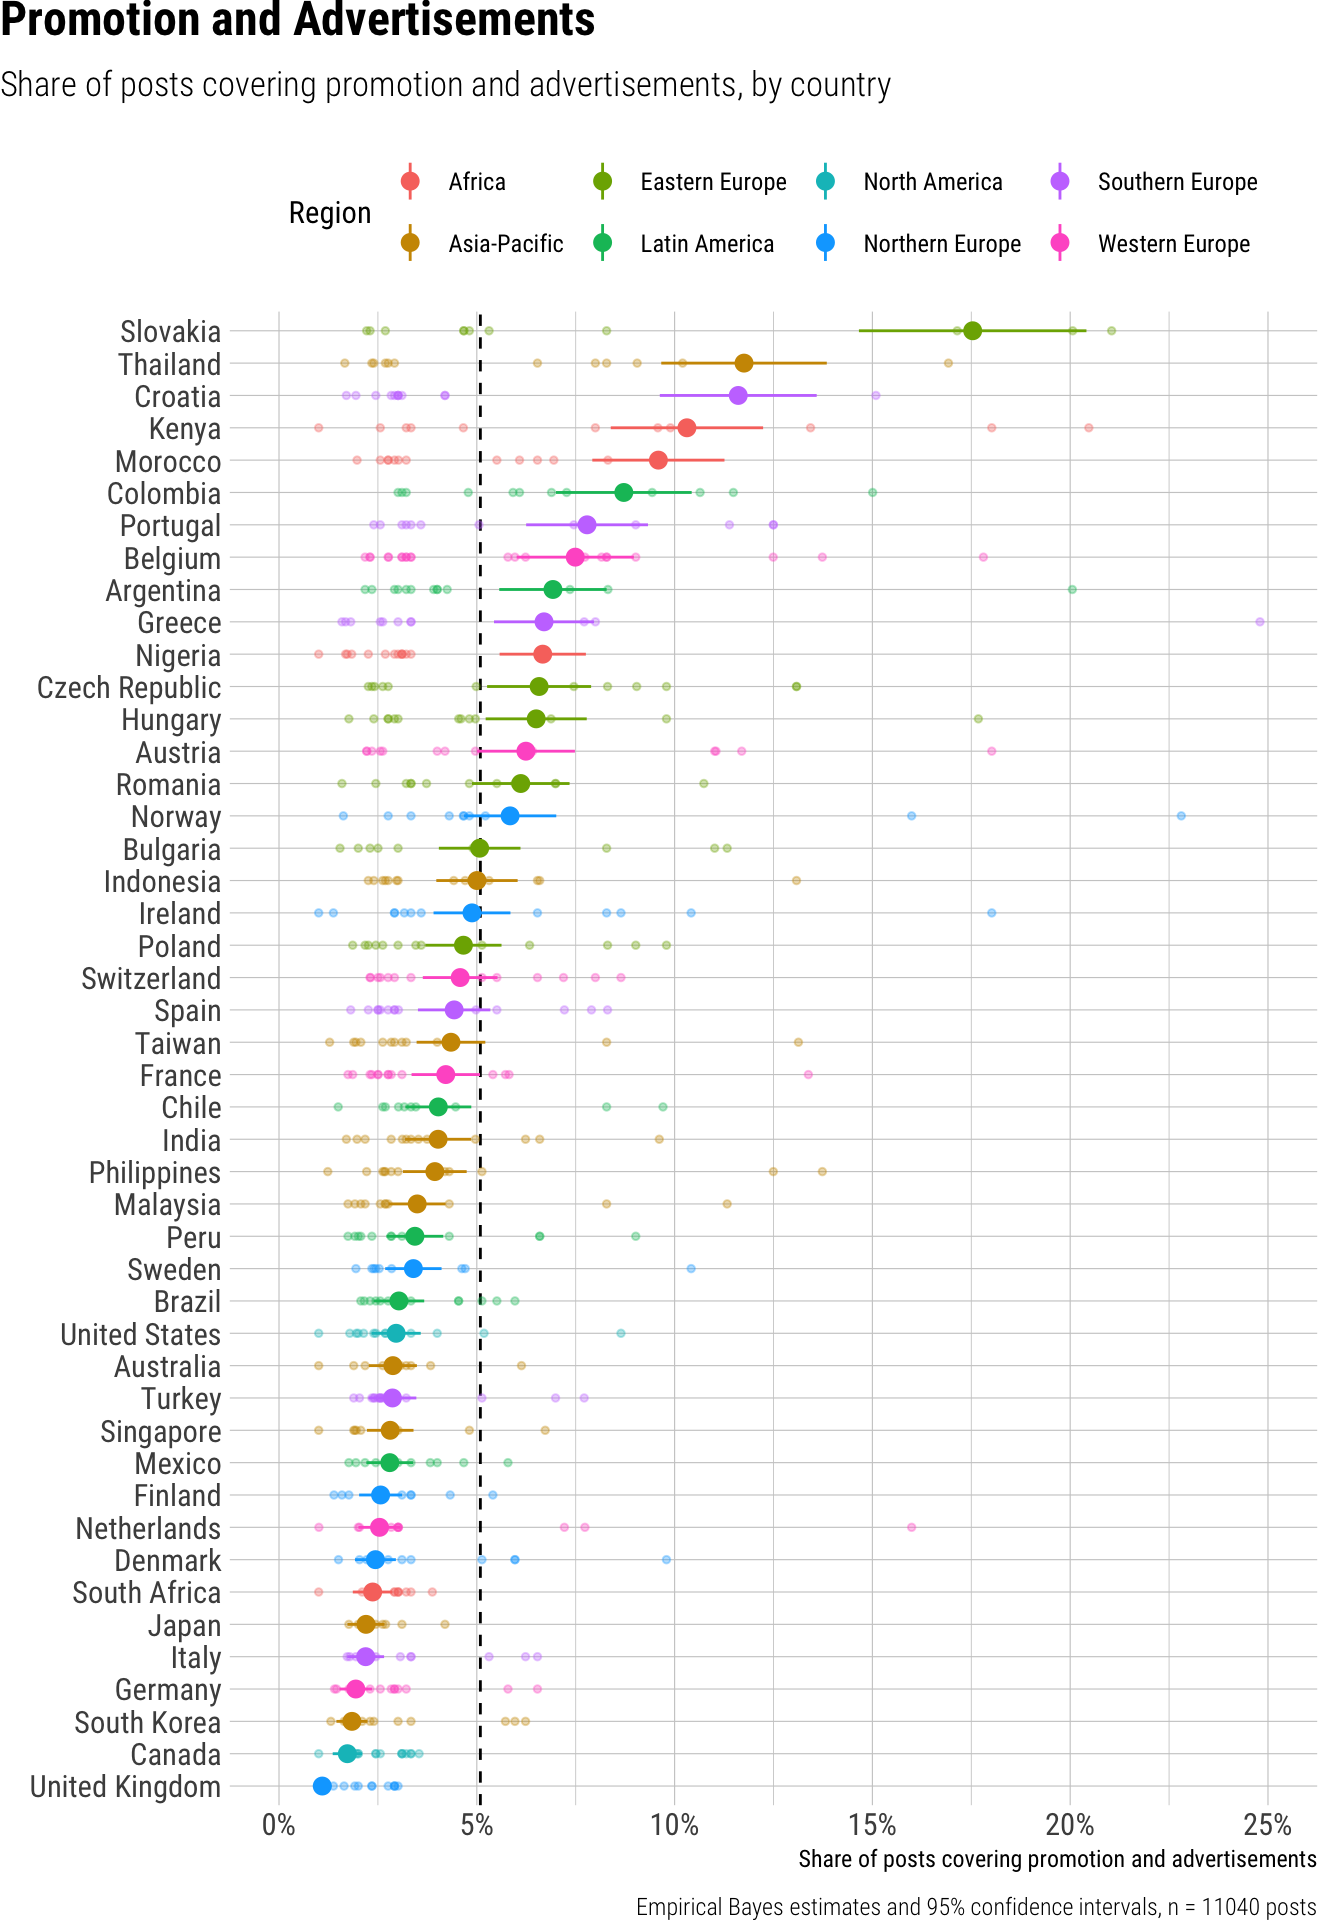
Result tables for Topic: Promotion
Overall average
| estimate | p.value | conf.low | conf.high |
|---|---|---|---|
| 0.05 | 0 | 0.04 | 0.06 |
Contrasts
| term | contrast | estimate | p.value | conf.low | conf.high |
|---|---|---|---|---|---|
| outlet_type | Print - Digital | -0.01 | 0.56 | -0.02 | 0.01 |
| outlet_type | Private broadcaster - Digital | 0.00 | 0.97 | -0.02 | 0.02 |
| outlet_type | Public broadcaster - Digital | -0.01 | 0.60 | -0.03 | 0.02 |
| platform | TikTok - Instagram | -0.05 | 0.00 | -0.06 | -0.04 |
| platform | YouTube Shorts - Instagram | -0.06 | 0.00 | -0.07 | -0.04 |
Predictions by platform
| platform | estimate | p.value | conf.low | conf.high |
|---|---|---|---|---|
| 0.09 | 0 | 0.07 | 0.10 | |
| TikTok | 0.03 | 0 | 0.02 | 0.04 |
| YouTube Shorts | 0.02 | 0 | 0.01 | 0.03 |
Predictions by outlet type
| outlet_type | estimate | p.value | conf.low | conf.high |
|---|---|---|---|---|
| Digital | 0.06 | 0 | 0.04 | 0.08 |
| 0.04 | 0 | 0.03 | 0.06 | |
| Private broadcaster | 0.05 | 0 | 0.04 | 0.07 |
| Public broadcaster | 0.04 | 0 | 0.03 | 0.06 |
Predictions by country
| country | estimate | p.value | conf.low | conf.high | region |
|---|---|---|---|---|---|
| Argentina | 0.07 | 0 | 0.06 | 0.08 | Latin America |
| Australia | 0.03 | 0 | 0.02 | 0.03 | Asia-Pacific |
| Austria | 0.06 | 0 | 0.05 | 0.07 | Western Europe |
| Belgium | 0.07 | 0 | 0.06 | 0.09 | Western Europe |
| Brazil | 0.03 | 0 | 0.02 | 0.04 | Latin America |
| Bulgaria | 0.05 | 0 | 0.04 | 0.06 | Eastern Europe |
| Canada | 0.02 | 0 | 0.01 | 0.02 | North America |
| Chile | 0.04 | 0 | 0.03 | 0.05 | Latin America |
| Colombia | 0.09 | 0 | 0.07 | 0.10 | Latin America |
| Croatia | 0.12 | 0 | 0.10 | 0.14 | Southern Europe |
| Czech Republic | 0.07 | 0 | 0.05 | 0.08 | Eastern Europe |
| Denmark | 0.02 | 0 | 0.02 | 0.03 | Northern Europe |
| Finland | 0.03 | 0 | 0.02 | 0.03 | Northern Europe |
| France | 0.04 | 0 | 0.03 | 0.05 | Western Europe |
| Germany | 0.02 | 0 | 0.02 | 0.02 | Western Europe |
| Greece | 0.07 | 0 | 0.05 | 0.08 | Southern Europe |
| Hungary | 0.07 | 0 | 0.05 | 0.08 | Eastern Europe |
| India | 0.04 | 0 | 0.03 | 0.05 | Asia-Pacific |
| Indonesia | 0.05 | 0 | 0.04 | 0.06 | Asia-Pacific |
| Ireland | 0.05 | 0 | 0.04 | 0.06 | Northern Europe |
| Italy | 0.02 | 0 | 0.02 | 0.03 | Southern Europe |
| Japan | 0.02 | 0 | 0.02 | 0.03 | Asia-Pacific |
| Kenya | 0.10 | 0 | 0.08 | 0.12 | Africa |
| Malaysia | 0.03 | 0 | 0.03 | 0.04 | Asia-Pacific |
| Mexico | 0.03 | 0 | 0.02 | 0.03 | Latin America |
| Morocco | 0.10 | 0 | 0.08 | 0.11 | Africa |
| Netherlands | 0.03 | 0 | 0.02 | 0.03 | Western Europe |
| Nigeria | 0.07 | 0 | 0.06 | 0.08 | Africa |
| Norway | 0.06 | 0 | 0.05 | 0.07 | Northern Europe |
| Peru | 0.03 | 0 | 0.03 | 0.04 | Latin America |
| Philippines | 0.04 | 0 | 0.03 | 0.05 | Asia-Pacific |
| Poland | 0.05 | 0 | 0.04 | 0.06 | Eastern Europe |
| Portugal | 0.08 | 0 | 0.06 | 0.09 | Southern Europe |
| Romania | 0.06 | 0 | 0.05 | 0.07 | Eastern Europe |
| Singapore | 0.03 | 0 | 0.02 | 0.03 | Asia-Pacific |
| Slovakia | 0.18 | 0 | 0.15 | 0.20 | Eastern Europe |
| South Africa | 0.02 | 0 | 0.02 | 0.03 | Africa |
| South Korea | 0.02 | 0 | 0.01 | 0.02 | Asia-Pacific |
| Spain | 0.04 | 0 | 0.04 | 0.05 | Southern Europe |
| Sweden | 0.03 | 0 | 0.03 | 0.04 | Northern Europe |
| Switzerland | 0.05 | 0 | 0.04 | 0.06 | Western Europe |
| Taiwan | 0.04 | 0 | 0.03 | 0.05 | Asia-Pacific |
| Thailand | 0.12 | 0 | 0.10 | 0.14 | Asia-Pacific |
| Turkey | 0.03 | 0 | 0.02 | 0.03 | Southern Europe |
| United Kingdom | 0.01 | 0 | 0.01 | 0.01 | Northern Europe |
| United States | 0.03 | 0 | 0.02 | 0.04 | North America |
User-Generated Performance and Comedy
Overall, 5% of short video posts published by news outlets covered user-generated performance and comedy. While Instagram and TikTok both saw an average of 5% of posts in this category, we observed a small but statistically significant difference, with TikTok’s share being slightly higher than Instagram’s. YouTube Shorts, by contrast, dedicated a lower 3% of its posts to this content. Looking at outlet types, digital outlets dedicated the largest share of their posts to this content, at 7%, closely followed by private broadcasters at 6%. Print outlets, however, featured this content significantly less, at just 2%, a share similar to public broadcasters at 3%. Country-level differences were substantial, ranging from a low of 1% in countries such as Australia, Canada, Germany, Mexico, Peru, and the United States, to highs of 15% in the Czech Republic, 13% in Romania and Taiwan, 12% in Hungary, and 11% in Kenya.
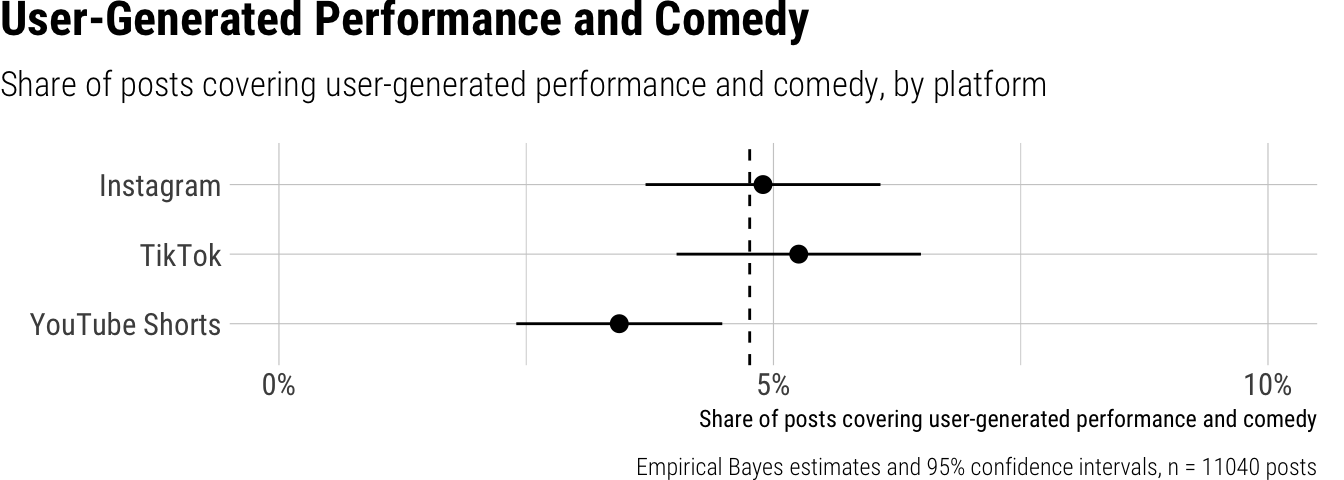
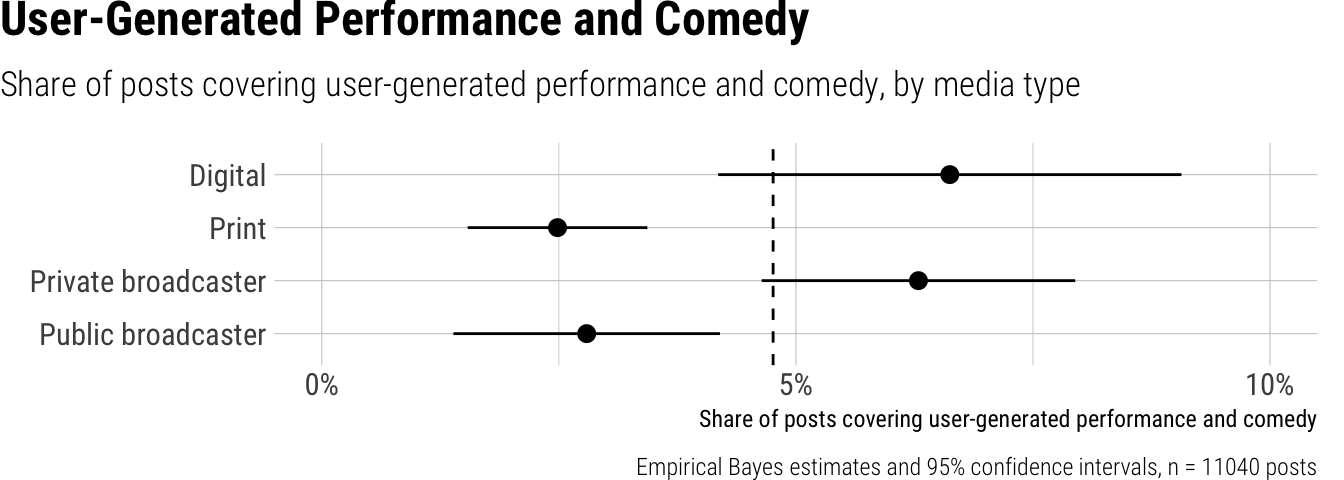
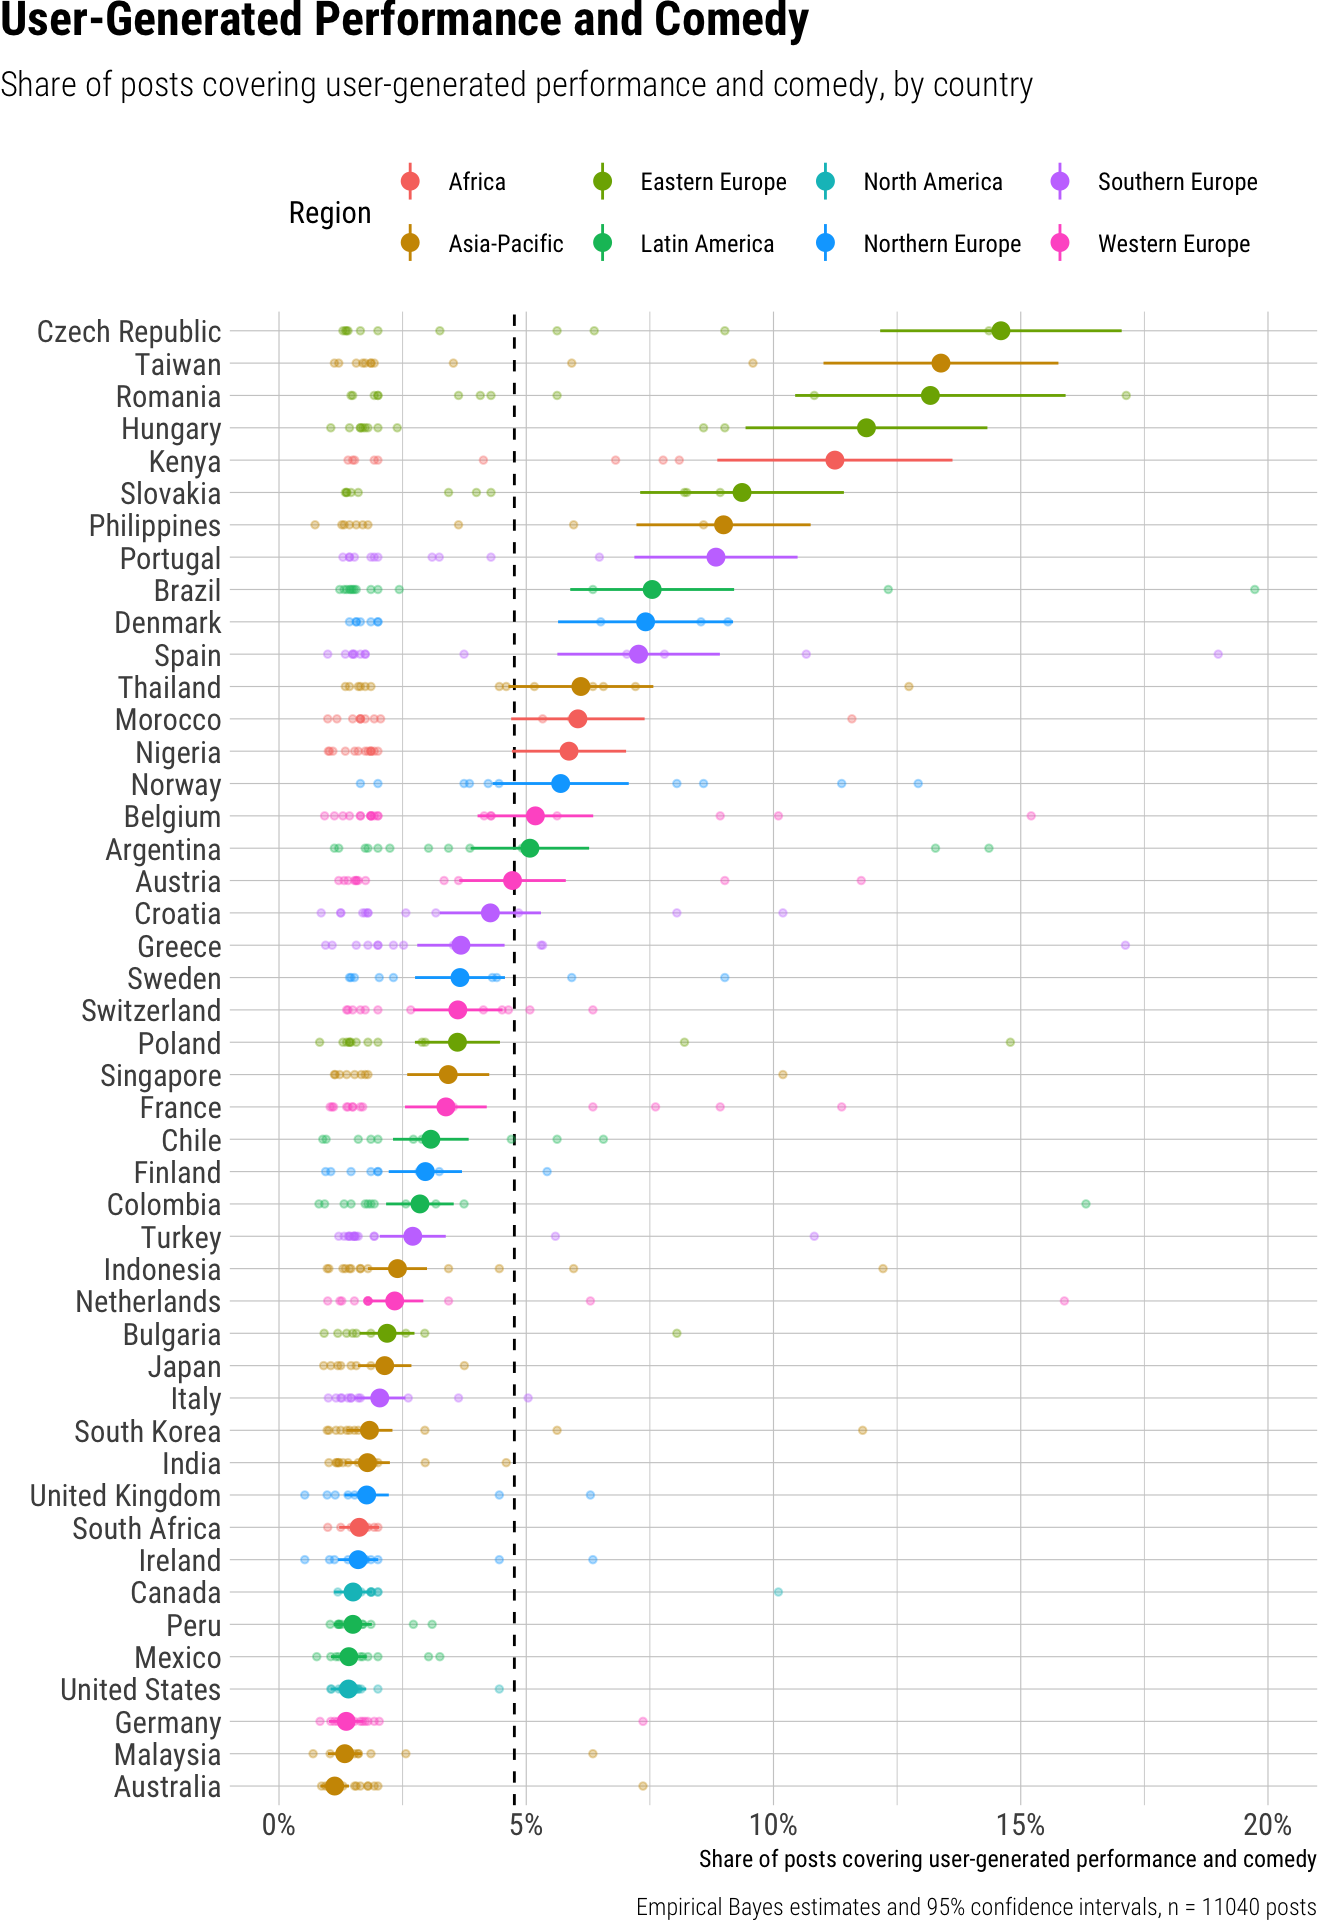
Result tables for Topic: User
Overall average
| estimate | p.value | conf.low | conf.high |
|---|---|---|---|
| 0.05 | 0 | 0.04 | 0.06 |
Contrasts
| term | contrast | estimate | p.value | conf.low | conf.high |
|---|---|---|---|---|---|
| outlet_type | Print - Digital | -0.03 | 0.01 | -0.05 | -0.01 |
| outlet_type | Private broadcaster - Digital | 0.01 | 0.68 | -0.02 | 0.03 |
| outlet_type | Public broadcaster - Digital | -0.02 | 0.18 | -0.04 | 0.01 |
| platform | TikTok - Instagram | 0.01 | 0.04 | 0.00 | 0.02 |
| platform | YouTube Shorts - Instagram | -0.01 | 0.34 | -0.02 | 0.01 |
Predictions by platform
| platform | estimate | p.value | conf.low | conf.high |
|---|---|---|---|---|
| 0.05 | 0 | 0.04 | 0.06 | |
| TikTok | 0.05 | 0 | 0.04 | 0.06 |
| YouTube Shorts | 0.03 | 0 | 0.02 | 0.04 |
Predictions by outlet type
| outlet_type | estimate | p.value | conf.low | conf.high |
|---|---|---|---|---|
| Digital | 0.07 | 0 | 0.04 | 0.09 |
| 0.02 | 0 | 0.02 | 0.03 | |
| Private broadcaster | 0.06 | 0 | 0.05 | 0.08 |
| Public broadcaster | 0.03 | 0 | 0.01 | 0.04 |
Predictions by country
| country | estimate | p.value | conf.low | conf.high | region |
|---|---|---|---|---|---|
| Argentina | 0.05 | 0 | 0.04 | 0.06 | Latin America |
| Australia | 0.01 | 0 | 0.01 | 0.01 | Asia-Pacific |
| Austria | 0.05 | 0 | 0.04 | 0.06 | Western Europe |
| Belgium | 0.05 | 0 | 0.04 | 0.06 | Western Europe |
| Brazil | 0.08 | 0 | 0.06 | 0.09 | Latin America |
| Bulgaria | 0.02 | 0 | 0.02 | 0.03 | Eastern Europe |
| Canada | 0.01 | 0 | 0.01 | 0.02 | North America |
| Chile | 0.03 | 0 | 0.02 | 0.04 | Latin America |
| Colombia | 0.03 | 0 | 0.02 | 0.04 | Latin America |
| Croatia | 0.04 | 0 | 0.03 | 0.05 | Southern Europe |
| Czech Republic | 0.15 | 0 | 0.12 | 0.17 | Eastern Europe |
| Denmark | 0.07 | 0 | 0.06 | 0.09 | Northern Europe |
| Finland | 0.03 | 0 | 0.02 | 0.04 | Northern Europe |
| France | 0.03 | 0 | 0.03 | 0.04 | Western Europe |
| Germany | 0.01 | 0 | 0.01 | 0.02 | Western Europe |
| Greece | 0.04 | 0 | 0.03 | 0.05 | Southern Europe |
| Hungary | 0.12 | 0 | 0.09 | 0.14 | Eastern Europe |
| India | 0.02 | 0 | 0.01 | 0.02 | Asia-Pacific |
| Indonesia | 0.02 | 0 | 0.02 | 0.03 | Asia-Pacific |
| Ireland | 0.02 | 0 | 0.01 | 0.02 | Northern Europe |
| Italy | 0.02 | 0 | 0.02 | 0.03 | Southern Europe |
| Japan | 0.02 | 0 | 0.02 | 0.03 | Asia-Pacific |
| Kenya | 0.11 | 0 | 0.09 | 0.14 | Africa |
| Malaysia | 0.01 | 0 | 0.01 | 0.02 | Asia-Pacific |
| Mexico | 0.01 | 0 | 0.01 | 0.02 | Latin America |
| Morocco | 0.06 | 0 | 0.05 | 0.07 | Africa |
| Netherlands | 0.02 | 0 | 0.02 | 0.03 | Western Europe |
| Nigeria | 0.06 | 0 | 0.05 | 0.07 | Africa |
| Norway | 0.06 | 0 | 0.04 | 0.07 | Northern Europe |
| Peru | 0.01 | 0 | 0.01 | 0.02 | Latin America |
| Philippines | 0.09 | 0 | 0.07 | 0.11 | Asia-Pacific |
| Poland | 0.04 | 0 | 0.03 | 0.04 | Eastern Europe |
| Portugal | 0.09 | 0 | 0.07 | 0.10 | Southern Europe |
| Romania | 0.13 | 0 | 0.10 | 0.16 | Eastern Europe |
| Singapore | 0.03 | 0 | 0.03 | 0.04 | Asia-Pacific |
| Slovakia | 0.09 | 0 | 0.07 | 0.11 | Eastern Europe |
| South Africa | 0.02 | 0 | 0.01 | 0.02 | Africa |
| South Korea | 0.02 | 0 | 0.01 | 0.02 | Asia-Pacific |
| Spain | 0.07 | 0 | 0.06 | 0.09 | Southern Europe |
| Sweden | 0.04 | 0 | 0.03 | 0.05 | Northern Europe |
| Switzerland | 0.04 | 0 | 0.03 | 0.05 | Western Europe |
| Taiwan | 0.13 | 0 | 0.11 | 0.16 | Asia-Pacific |
| Thailand | 0.06 | 0 | 0.05 | 0.08 | Asia-Pacific |
| Turkey | 0.03 | 0 | 0.02 | 0.03 | Southern Europe |
| United Kingdom | 0.02 | 0 | 0.01 | 0.02 | Northern Europe |
| United States | 0.01 | 0 | 0.01 | 0.02 | North America |
Measures
Topics were coded using using zero-short classification on post text and transcript, with categories from the Electronic News Archive (ENA) of the University of Antwerp and additional topics.
Coding instructions
Your task is to analyze the provided short video content (derived from caption text and transcripts) and determine whether its topic explicitly falls into one or more of the following categories. Your decision for each category must be based only on direct and explicit mentions of the category’s subject matter within the caption text or transcript. Do not infer or extrapolate beyond the directly stated information. If a category’s subject is not explicitly mentioned, even if indirectly related, you must classify it as “False.”
Please evaluate the provided short video content against each of the following 19 categories independently:
politics: Code “True” if the caption text or transcript explicitly discusses political structures, electoral processes, or international governance. This includes explicit mentions of political organizations, elections, migration policies, and international relations between countries.
law_enforcement_and_crime: Code “True” if the caption text or transcript explicitly deals with the legal system, law enforcement activities, or criminal acts. This includes explicit mentions of the judiciary, crime policy, specific instances of crime, and civil rights and freedoms.
war_disasters_accidents: Code “True” if the caption text or transcript explicitly reports on armed conflicts, defense matters, or major calamitous events. This includes explicit discussions of war and peace, weaponry, and natural or man-made disasters and accidents.
economy_and_finance: Code “True” if the caption text or transcript explicitly focuses on economic activity, financial markets, or labor. This includes explicit mentions of finance (e.g., banking, stock markets), the general economy, consumer affairs, and labor issues like employment or wages.
social_affairs: Code “True” if the caption text or transcript explicitly is centered on broad societal issues and demographic trends. This includes explicit mentions of social policies like healthcare, social security, and housing, as well as population growth or aging.
health_and_fitness: Code “True” if the caption text or transcript explicitly focuses on personal health, medical conditions, physical fitness, or wellness. This includes explicit mentions of diet, exercise, mental health, and general medical advice, distinct from healthcare policy.
mobility_and_infrastructure: Code “True” if the caption text or transcript explicitly discusses transportation systems or public works. This includes explicit mentions of mobility, traffic, and spatial planning, such as urban development or infrastructure projects.
environment_and_energy: Code “True” if the caption text or transcript explicitly concerns the natural world, energy resources, or food production. This includes explicit mentions of environmental protection, nature conservation, energy policy, and agriculture.
science_technology_and_education: Code “True” if the caption text or transcript explicitly is about scientific research, technological advancements, or education systems. This includes explicit mentions of cultural patrimony, the education sector, aerospace exploration, and telecommunication.
culture_and_arts: Code “True” if the caption text or transcript explicitly focuses on creative and fine arts or matters of faith. This includes explicit mentions of performing arts (e.g., theater, dance), literature, visual arts (e.g., painting), and religion.
lifestyle_and_travel: Code “True” if the caption text or transcript explicitly covers personal interests, leisure activities, travel, or daily routines. This includes explicit mentions of general lifestyle topics (e.g., hobbies), tourism, personal vlogs, and “day-in-the-life” content.
fashion_and_beauty: Code “True” if the caption text or transcript explicitly focuses on clothing, accessories, personal style, makeup, skincare, or cosmetic products. This includes explicit mentions of fashion hauls, outfit styling, makeup tutorials, and product reviews within these areas.
food_and_cooking: Code “True” if the caption text or transcript explicitly discusses recipes, cooking techniques, food preparation, dining experiences, food reviews, or specific food items. This includes explicit mentions of quick meals, baking, restaurant reviews, and food-related challenges.
pets_and_animals: Code “True” if the caption text or transcript explicitly features or discusses domestic pets, wild animals, animal behavior, or animal care, with the primary focus being the animal itself.
entertainment_news_and_industry: Code “True” if the caption text or transcript explicitly discusses news, releases, reviews, or industry aspects related to professional film, television, or music. This includes explicit mentions of movie releases, album launches, TV show reviews, film festivals, and the business operations of traditional media companies.
celebrity: Code “True” if the caption text or transcript explicitly focuses on the personal lives, private relationships, or non-professional activities of famous individuals. For any famous individual (e.g., politician, athlete, pop star, royals), code “True” only if the content explicitly concerns their personal life or non-professional activities. Otherwise, their professional activities should only be classified under the relevant category such as politics, sports, etc. Attention: Simply mentioning a famous person, e.g. a president or queen, is not sufficient for a post being coded as “True” celebrity news.
sports: Code “True” if the caption text or transcript explicitly is about sports as a field of activity. This includes explicit coverage of sporting events, competitions, games, teams, and the professional performance of sports athletes.
promotion_and_advertisements: Code “True” if the caption text or transcript explicitly promotes a product, service, brand, event, or specific call to action with a commercial intent. This includes explicit mentions of sales, discounts, sponsorships, brand endorsements, or direct calls to purchase or visit a business.
user_generated_performance_and_comedy: Code “True” if the caption text or transcript explicitly features or discusses performances by users, often for entertainment, and/or comedic content. This includes explicit mentions of dance routines, lip-sync videos, short-form skits, memes, and viral trends where a user’s performance or comedic element is central.
Reliability
Models used: gemini-2.5-flash-lite, Qwen3 235B VL.
| Variable | Posts | Models | Agreement | Krippendorffs_Alpha |
|---|---|---|---|---|
| Politics | 200 | 2 | 0.91 | 0.79 |
| Law Enforcement and Crime | 200 | 2 | 0.94 | 0.85 |
| War, Disasters, and Accidents | 200 | 2 | 0.96 | 0.88 |
| Economy and Finance | 200 | 2 | 0.96 | 0.83 |
| Social Affairs | 200 | 2 | 0.92 | 0.72 |
| Health and Fitness | 200 | 2 | 0.96 | 0.62 |
| Mobility and Infrastructure | 200 | 2 | 0.99 | 0.90 |
| Environment and Energy | 200 | 2 | 0.99 | 0.90 |
| Science, Technology, and Education | 200 | 2 | 1.00 | 1.00 |
| Culture and Arts | 200 | 2 | 0.94 | 0.67 |
| Lifestyle and Travel | 200 | 2 | 0.97 | 0.80 |
| Fashion and Beauty | 200 | 2 | 1.00 | 0.80 |
| Food and Cooking | 200 | 2 | 0.99 | 0.91 |
| Pets and Animals | 200 | 2 | 0.99 | 0.85 |
| Entertainment News and Industry | 200 | 2 | 0.96 | 0.76 |
| Celebrity and Royalty | 200 | 2 | 0.96 | 0.77 |
| Sports | 200 | 2 | 0.99 | 0.87 |
| Promotion and Advertisements | 200 | 2 | 0.98 | 0.74 |
| User-Generated Performance and Comedy | 200 | 2 | 0.96 | 0.50 |
TODO
Social Affairs
Across news outlets, an average of 16% of short video posts covered social affairs. While differences across platforms were generally small, we observed that Instagram posts contained slightly more social affairs content at 17% compared to YouTube Shorts at 15%, with TikTok at 16% falling in between. More notable differences emerged when examining outlet types: public broadcasters dedicated a significantly larger share of their posts to social affairs, at 21%, whereas digital outlets posted the least at 14%, with print and private broadcasters both around 16%. Country-level variations were substantial, ranging from a low of 9% in Taiwan and 10% in Greece and the Philippines, to a high of 29% in Nigeria, followed by 25% in Bulgaria and 24% in Germany.
Overall average
Contrasts
Predictions by platform
Predictions by outlet type
Predictions by country