| Platform | Outlets | Posts | % |
|---|---|---|---|
| TikTok | 472 | 85,696 | 46 |
| 486 | 62,936 | 34 | |
| YouTube Shorts | 395 | 37,337 | 20 |
Key metrics
AI summaries
Note that all the summary texts on this page are currently generated automatically using a Large Language Model (Google’s Gemini), based on the results tables and other information from the data. Therefore, please do not cite the verbal summary, but refer to the figures and tables for accurate information.
Publication patterns
The Platform News Report is based on data from 571 news outlets across 46 countries. We collected 185,969 posts published by these outlets on TikTok, Instagram, and YouTube Shorts from March 15 to April 15, 2025.
While Instagram had the biggest market share in terms of active news outlets, the amount of content posted on TikTok was much larger overall, with almost half of all posts in our sample coming from this platform, followed by Instagram, and YouTube Shorts, which also attracted far fewer outlets overall.
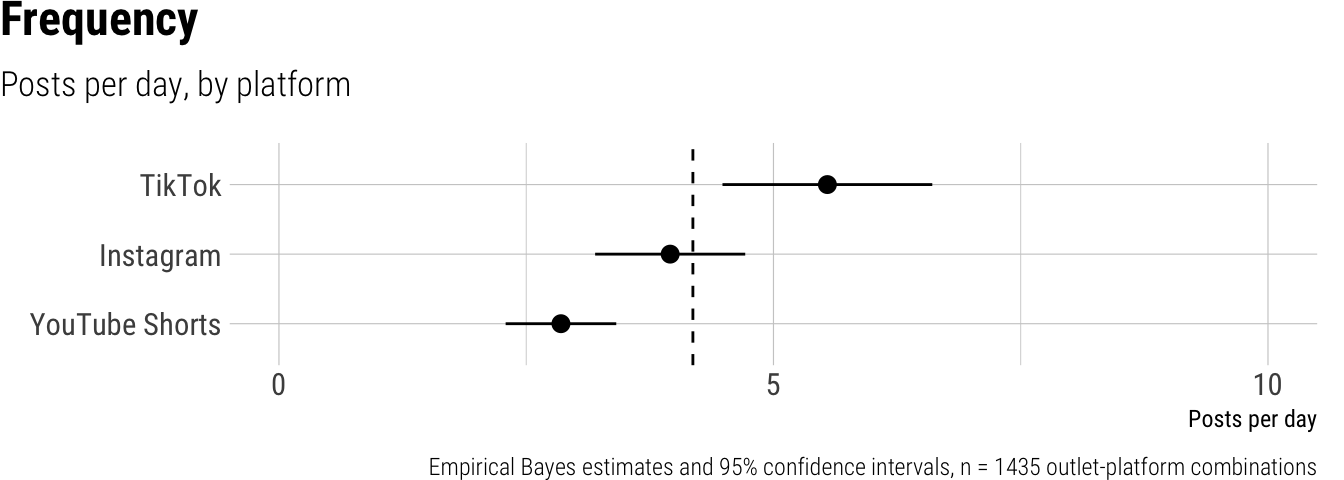
Frequency
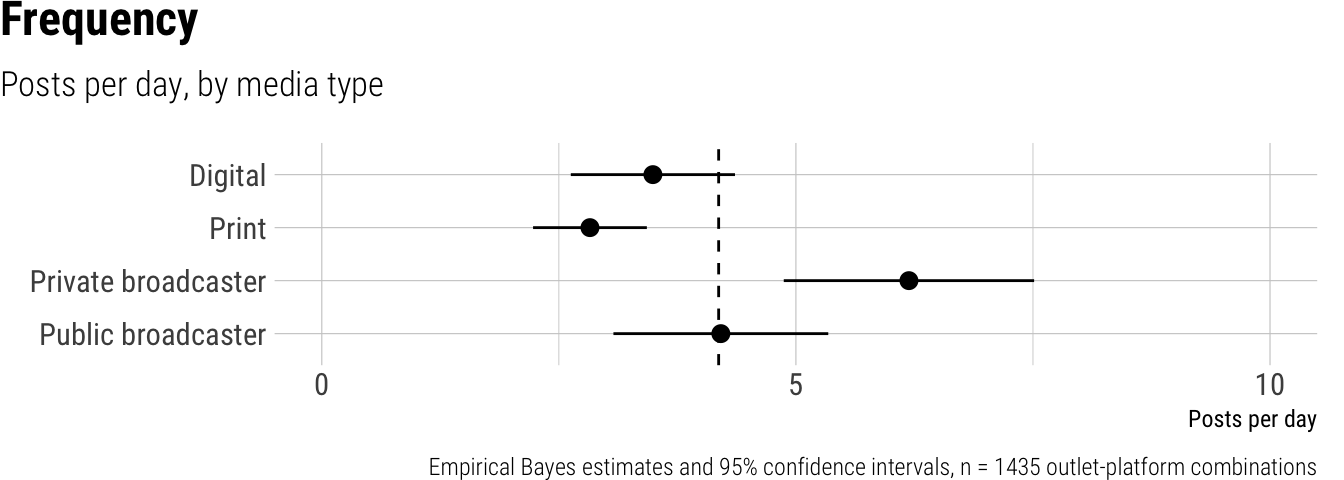
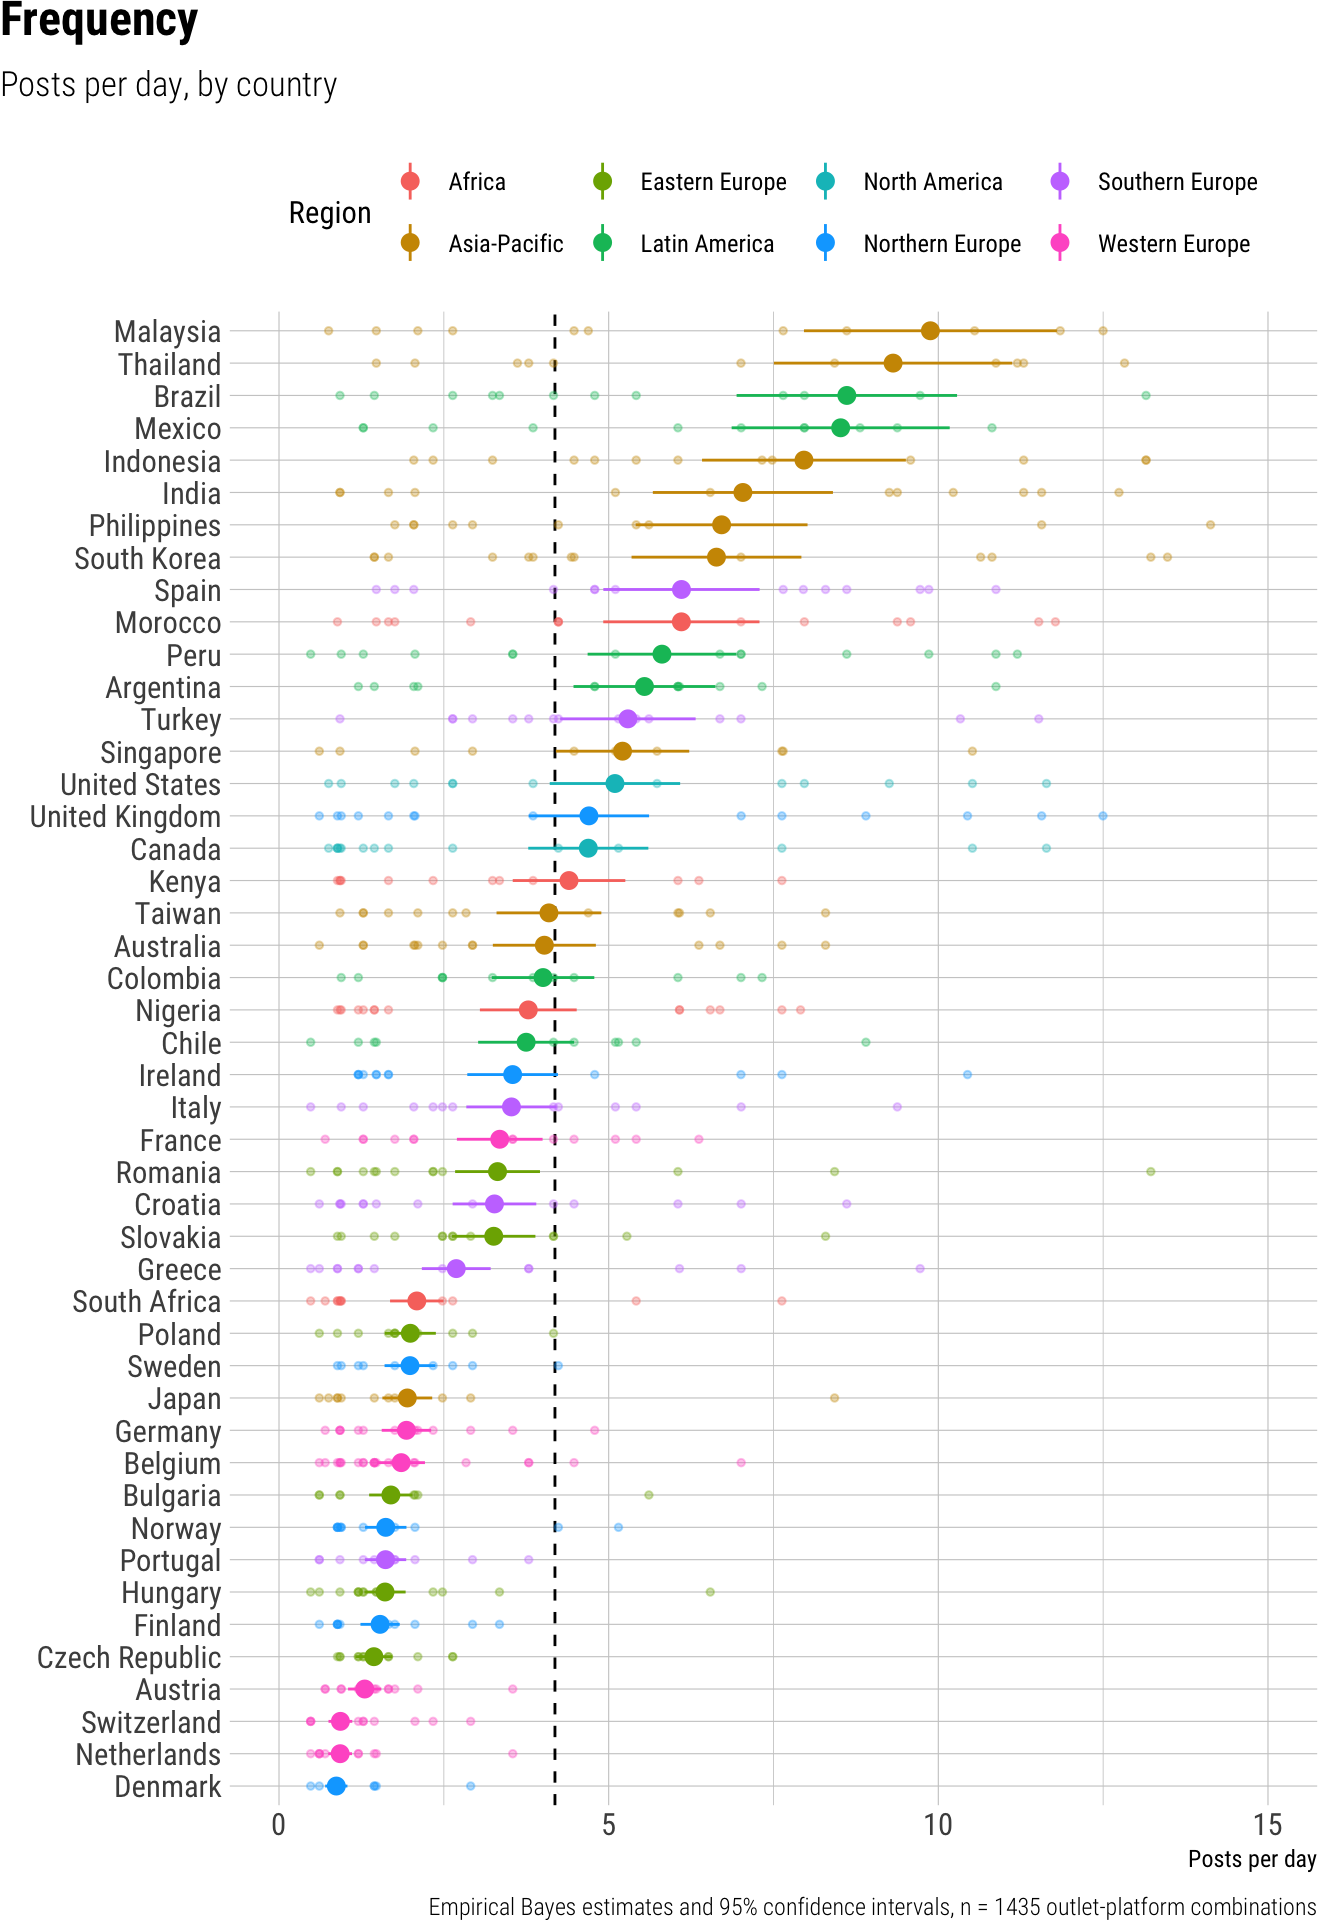
Across all platforms, news outlets published an average of 4 posts per day in the form of short videos. Breaking this down by platform, we saw outlets posting most frequently on TikTok, averaging 5.6 posts per day, followed by Instagram at 4.0 posts per day, and YouTube Shorts at 2.9 posts per day. This represented a significant difference, with TikTok receiving substantially more content than both Instagram and YouTube Shorts. Outlet type also played a significant role in posting frequency: private broadcasters led the charge, publishing an average of 6.2 posts per day, which was notably higher than the 4.2 posts per day from public broadcasters and the 3.5 posts per day from digital-only outlets. Print news outlets posted the least frequently, averaging 2.8 posts per day, though the difference between print and digital outlets was small and non-significant. Finally, posting habits varied considerably by country; for instance, outlets in Malaysia published nearly 9.9 posts per day, while those in Denmark and the Netherlands posted less than 1 post per day.
Result tables for Frequency
Overall average
| estimate | p.value | conf.low | conf.high |
|---|---|---|---|
| 4.19 | 0 | 3.37 | 5 |
Contrasts
| term | contrast | estimate | p.value | conf.low | conf.high |
|---|---|---|---|---|---|
| outlet_type | Print - Digital | -0.14 | 0.68 | -0.79 | 0.51 |
| outlet_type | Private broadcaster - Digital | 3.43 | 0.00 | 2.30 | 4.57 |
| outlet_type | Public broadcaster - Digital | 1.27 | 0.02 | 0.20 | 2.33 |
| platform | Instagram - TikTok | -1.14 | 0.00 | -1.50 | -0.79 |
| platform | YouTube Shorts - TikTok | -2.83 | 0.00 | -3.42 | -2.24 |
Predictions by platform
| platform | estimate | p.value | conf.low | conf.high |
|---|---|---|---|---|
| TikTok | 5.55 | 0 | 4.48 | 6.61 |
| 3.96 | 0 | 3.20 | 4.71 | |
| YouTube Shorts | 2.85 | 0 | 2.29 | 3.41 |
Predictions by outlet type
| outlet_type | estimate | p.value | conf.low | conf.high |
|---|---|---|---|---|
| Digital | 3.49 | 0 | 2.63 | 4.36 |
| 2.83 | 0 | 2.23 | 3.43 | |
| Private broadcaster | 6.19 | 0 | 4.87 | 7.51 |
| Public broadcaster | 4.21 | 0 | 3.08 | 5.34 |
Predictions by country
| country | estimate | p.value | conf.low | conf.high | region |
|---|---|---|---|---|---|
| Argentina | 5.54 | 0 | 4.47 | 6.62 | Latin America |
| Australia | 4.02 | 0 | 3.24 | 4.81 | Asia-Pacific |
| Austria | 1.30 | 0 | 1.05 | 1.55 | Western Europe |
| Belgium | 1.85 | 0 | 1.49 | 2.21 | Western Europe |
| Brazil | 8.61 | 0 | 6.94 | 10.28 | Latin America |
| Bulgaria | 1.70 | 0 | 1.37 | 2.03 | Eastern Europe |
| Canada | 4.69 | 0 | 3.78 | 5.60 | North America |
| Chile | 3.75 | 0 | 3.02 | 4.48 | Latin America |
| Colombia | 4.00 | 0 | 3.23 | 4.78 | Latin America |
| Croatia | 3.27 | 0 | 2.63 | 3.90 | Southern Europe |
| Czech Republic | 1.44 | 0 | 1.16 | 1.72 | Eastern Europe |
| Denmark | 0.87 | 0 | 0.70 | 1.04 | Northern Europe |
| Finland | 1.53 | 0 | 1.24 | 1.83 | Northern Europe |
| France | 3.35 | 0 | 2.70 | 4.00 | Western Europe |
| Germany | 1.93 | 0 | 1.56 | 2.31 | Western Europe |
| Greece | 2.69 | 0 | 2.17 | 3.21 | Southern Europe |
| Hungary | 1.61 | 0 | 1.30 | 1.92 | Eastern Europe |
| India | 7.04 | 0 | 5.67 | 8.40 | Asia-Pacific |
| Indonesia | 7.96 | 0 | 6.42 | 9.51 | Asia-Pacific |
| Ireland | 3.54 | 0 | 2.86 | 4.23 | Northern Europe |
| Italy | 3.53 | 0 | 2.84 | 4.21 | Southern Europe |
| Japan | 1.95 | 0 | 1.57 | 2.32 | Asia-Pacific |
| Kenya | 4.40 | 0 | 3.54 | 5.25 | Africa |
| Malaysia | 9.88 | 0 | 7.96 | 11.80 | Asia-Pacific |
| Mexico | 8.52 | 0 | 6.87 | 10.17 | Latin America |
| Morocco | 6.10 | 0 | 4.92 | 7.29 | Africa |
| Netherlands | 0.93 | 0 | 0.75 | 1.11 | Western Europe |
| Nigeria | 3.78 | 0 | 3.05 | 4.51 | Africa |
| Norway | 1.62 | 0 | 1.30 | 1.93 | Northern Europe |
| Peru | 5.81 | 0 | 4.68 | 6.94 | Latin America |
| Philippines | 6.71 | 0 | 5.41 | 8.02 | Asia-Pacific |
| Poland | 1.99 | 0 | 1.61 | 2.38 | Eastern Europe |
| Portugal | 1.62 | 0 | 1.30 | 1.93 | Southern Europe |
| Romania | 3.31 | 0 | 2.67 | 3.96 | Eastern Europe |
| Singapore | 5.21 | 0 | 4.20 | 6.22 | Asia-Pacific |
| Slovakia | 3.26 | 0 | 2.62 | 3.89 | Eastern Europe |
| South Africa | 2.09 | 0 | 1.68 | 2.50 | Africa |
| South Korea | 6.64 | 0 | 5.35 | 7.92 | Asia-Pacific |
| Spain | 6.10 | 0 | 4.92 | 7.29 | Southern Europe |
| Sweden | 1.99 | 0 | 1.60 | 2.37 | Northern Europe |
| Switzerland | 0.93 | 0 | 0.75 | 1.11 | Western Europe |
| Taiwan | 4.09 | 0 | 3.30 | 4.89 | Asia-Pacific |
| Thailand | 9.31 | 0 | 7.51 | 11.12 | Asia-Pacific |
| Turkey | 5.29 | 0 | 4.26 | 6.32 | Southern Europe |
| United Kingdom | 4.70 | 0 | 3.79 | 5.61 | Northern Europe |
| United States | 5.10 | 0 | 4.11 | 6.08 | North America |
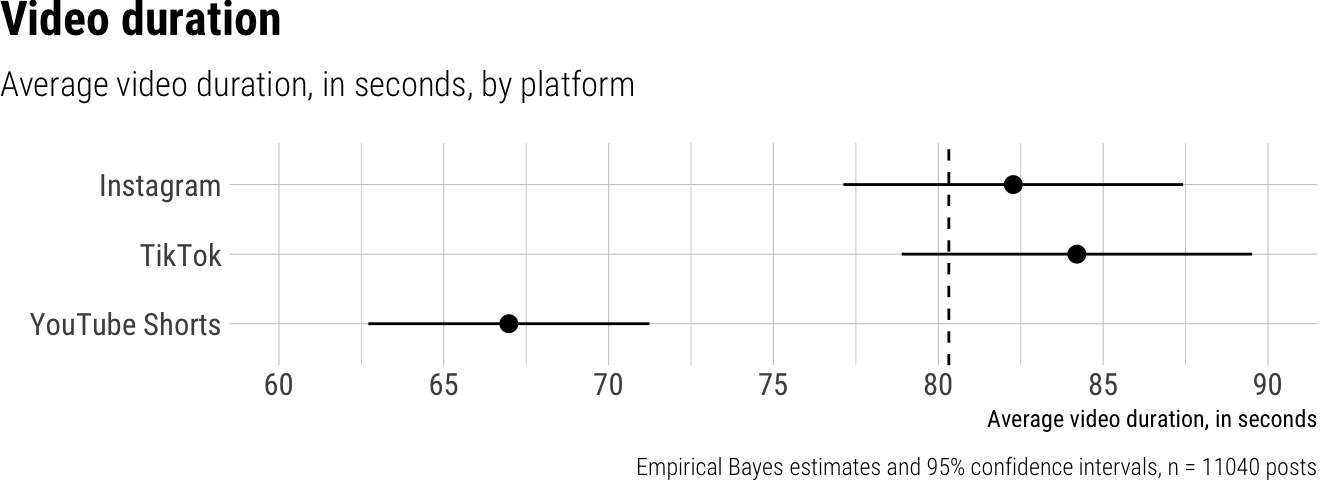
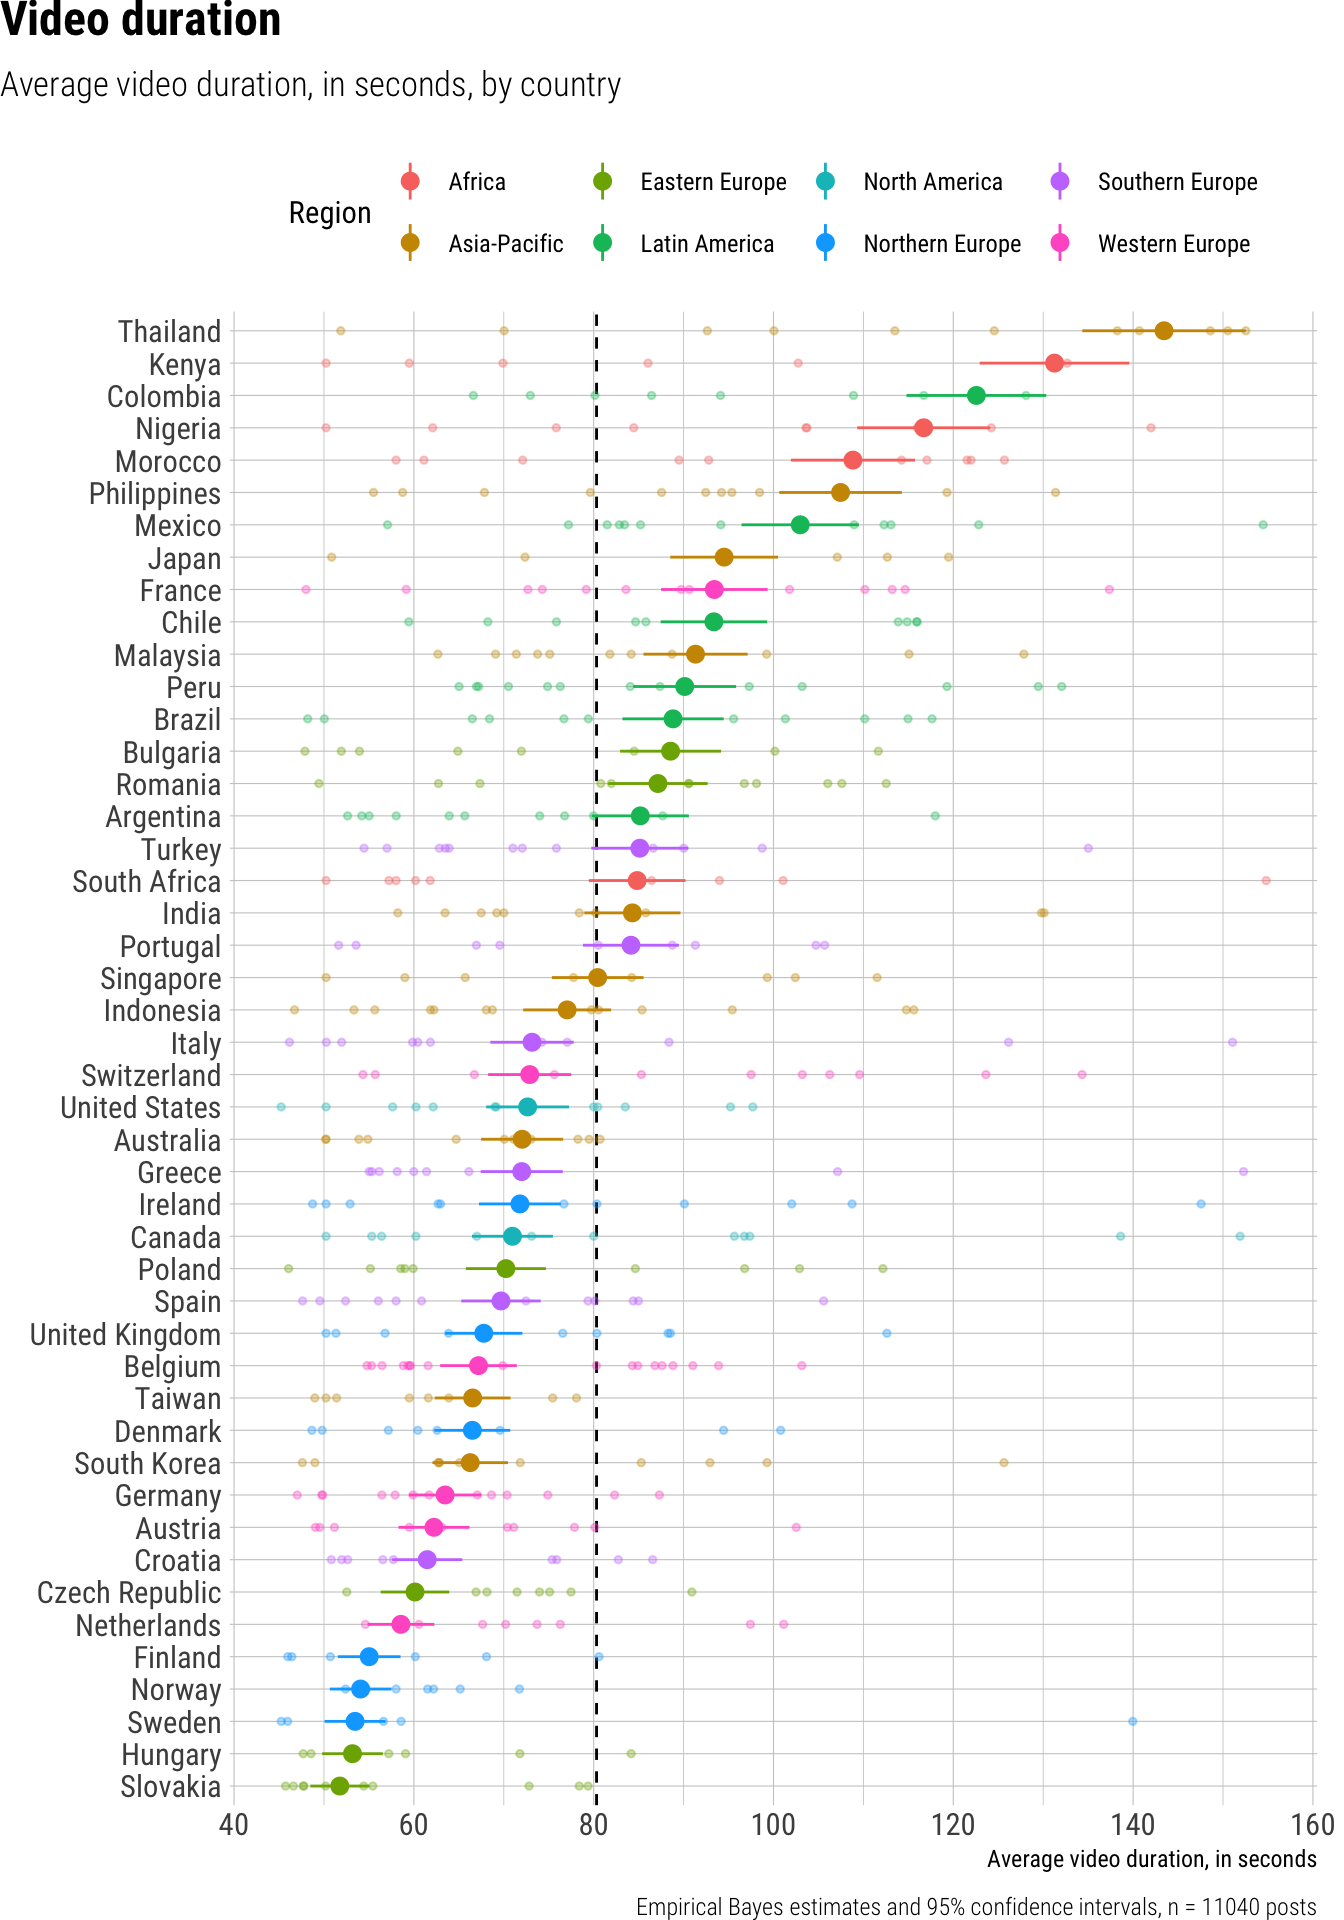
Video duration
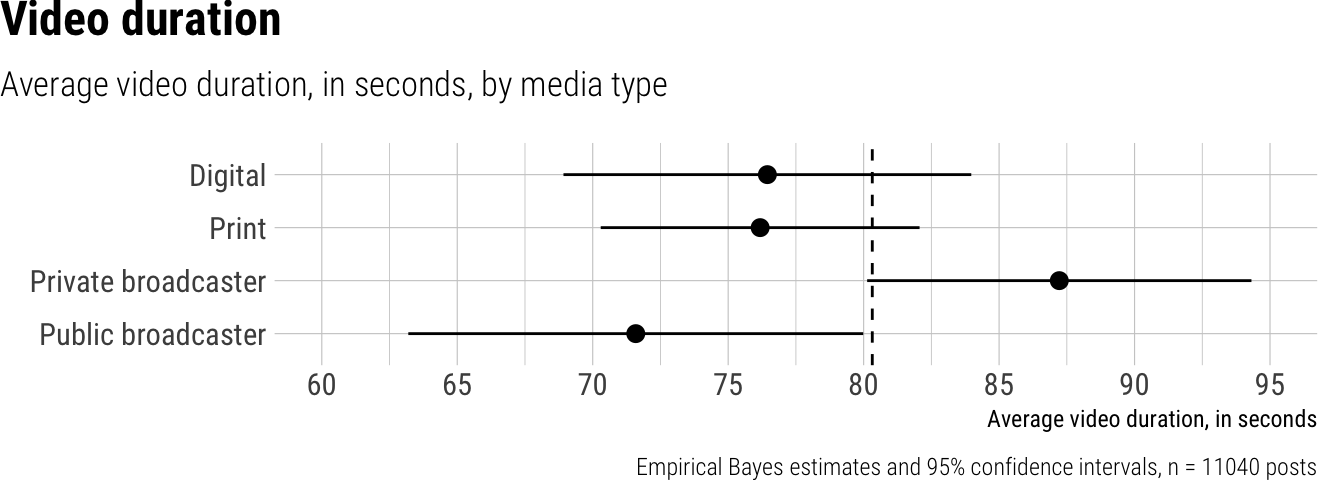
Across news outlets worldwide, the average duration of short video posts was approximately 80 seconds. Looking at specific platforms, we observed modest, yet statistically significant, differences, with videos on Instagram averaging 82 seconds and TikTok videos slightly longer at 84 seconds. YouTube Shorts, however, featured considerably shorter content, averaging 67 seconds per post. Differences also emerged among outlet types; private broadcasters notably published longer videos, averaging 87 seconds, which was significantly longer than Digital outlets, which posted videos around 76 seconds. Print outlets also had an average video duration of about 76 seconds, while public broadcasters tended to post shorter content, at approximately 72 seconds. We noted substantial variation across countries, with average video durations ranging from a low of 52 seconds in Slovakia to a high of 143 seconds in Thailand, highlighting diverse global practices in short-form video production.
Result tables for Video duration
Overall average
| estimate | p.value | conf.low | conf.high |
|---|---|---|---|
| 80.32 | 0 | 75.23 | 85.41 |
Contrasts
| term | contrast | estimate | p.value | conf.low | conf.high |
|---|---|---|---|---|---|
| outlet_type | Print - Digital | 7.11 | 0.07 | -0.60 | 14.83 |
| outlet_type | Private broadcaster - Digital | 13.76 | 0.00 | 5.54 | 21.98 |
| outlet_type | Public broadcaster - Digital | 5.17 | 0.32 | -5.01 | 15.36 |
| platform | TikTok - Instagram | 1.64 | 0.00 | 1.18 | 2.11 |
| platform | YouTube Shorts - Instagram | -15.73 | 0.00 | -16.85 | -14.61 |
Predictions by platform
| platform | estimate | p.value | conf.low | conf.high |
|---|---|---|---|---|
| 82.28 | 0 | 77.12 | 87.43 | |
| TikTok | 84.20 | 0 | 78.89 | 89.52 |
| YouTube Shorts | 66.97 | 0 | 62.71 | 71.24 |
Predictions by outlet type
| outlet_type | estimate | p.value | conf.low | conf.high |
|---|---|---|---|---|
| Digital | 76.45 | 0 | 68.92 | 83.97 |
| 76.18 | 0 | 70.30 | 82.06 | |
| Private broadcaster | 87.22 | 0 | 80.13 | 94.31 |
| Public broadcaster | 71.59 | 0 | 63.19 | 79.99 |
Predictions by country
| country | estimate | p.value | conf.low | conf.high | region |
|---|---|---|---|---|---|
| Argentina | 85.19 | 0 | 79.78 | 90.59 | Latin America |
| Australia | 72.04 | 0 | 67.48 | 76.61 | Asia-Pacific |
| Austria | 62.24 | 0 | 58.29 | 66.18 | Western Europe |
| Belgium | 67.19 | 0 | 62.93 | 71.45 | Western Europe |
| Brazil | 88.83 | 0 | 83.19 | 94.46 | Latin America |
| Bulgaria | 88.55 | 0 | 82.94 | 94.17 | Eastern Europe |
| Canada | 70.97 | 0 | 66.47 | 75.47 | North America |
| Chile | 93.37 | 0 | 87.45 | 99.29 | Latin America |
| Colombia | 122.56 | 0 | 114.79 | 130.34 | Latin America |
| Croatia | 61.48 | 0 | 57.59 | 65.38 | Southern Europe |
| Czech Republic | 60.12 | 0 | 56.31 | 63.94 | Eastern Europe |
| Denmark | 66.50 | 0 | 62.29 | 70.72 | Northern Europe |
| Finland | 55.03 | 0 | 51.54 | 58.52 | Northern Europe |
| France | 93.42 | 0 | 87.50 | 99.35 | Western Europe |
| Germany | 63.48 | 0 | 59.45 | 67.50 | Western Europe |
| Greece | 72.00 | 0 | 67.43 | 76.56 | Southern Europe |
| Hungary | 53.17 | 0 | 49.80 | 56.55 | Eastern Europe |
| India | 84.31 | 0 | 78.96 | 89.65 | Asia-Pacific |
| Indonesia | 77.05 | 0 | 72.16 | 81.93 | Asia-Pacific |
| Ireland | 71.80 | 0 | 67.24 | 76.35 | Northern Europe |
| Italy | 73.15 | 0 | 68.51 | 77.78 | Southern Europe |
| Japan | 94.51 | 0 | 88.52 | 100.51 | Asia-Pacific |
| Kenya | 131.26 | 0 | 122.94 | 139.58 | Africa |
| Malaysia | 91.33 | 0 | 85.54 | 97.12 | Asia-Pacific |
| Mexico | 102.97 | 0 | 96.44 | 109.50 | Latin America |
| Morocco | 108.84 | 0 | 101.94 | 115.74 | Africa |
| Netherlands | 58.56 | 0 | 54.84 | 62.27 | Western Europe |
| Nigeria | 116.71 | 0 | 109.31 | 124.11 | Africa |
| Norway | 54.07 | 0 | 50.65 | 57.50 | Northern Europe |
| Peru | 90.13 | 0 | 84.41 | 95.84 | Latin America |
| Philippines | 107.46 | 0 | 100.65 | 114.28 | Asia-Pacific |
| Poland | 70.24 | 0 | 65.78 | 74.69 | Eastern Europe |
| Portugal | 84.15 | 0 | 78.81 | 89.48 | Southern Europe |
| Romania | 87.15 | 0 | 81.62 | 92.67 | Eastern Europe |
| Singapore | 80.44 | 0 | 75.34 | 85.55 | Asia-Pacific |
| Slovakia | 51.76 | 0 | 48.48 | 55.04 | Eastern Europe |
| South Africa | 84.84 | 0 | 79.46 | 90.22 | Africa |
| South Korea | 66.27 | 0 | 62.06 | 70.47 | Asia-Pacific |
| Spain | 69.69 | 0 | 65.27 | 74.11 | Southern Europe |
| Sweden | 53.46 | 0 | 50.07 | 56.85 | Northern Europe |
| Switzerland | 72.88 | 0 | 68.26 | 77.51 | Western Europe |
| Taiwan | 66.54 | 0 | 62.32 | 70.76 | Asia-Pacific |
| Thailand | 143.44 | 0 | 134.34 | 152.53 | Asia-Pacific |
| Turkey | 85.13 | 0 | 79.73 | 90.53 | Southern Europe |
| United Kingdom | 67.77 | 0 | 63.48 | 72.07 | Northern Europe |
| United States | 72.65 | 0 | 68.05 | 77.26 | North America |
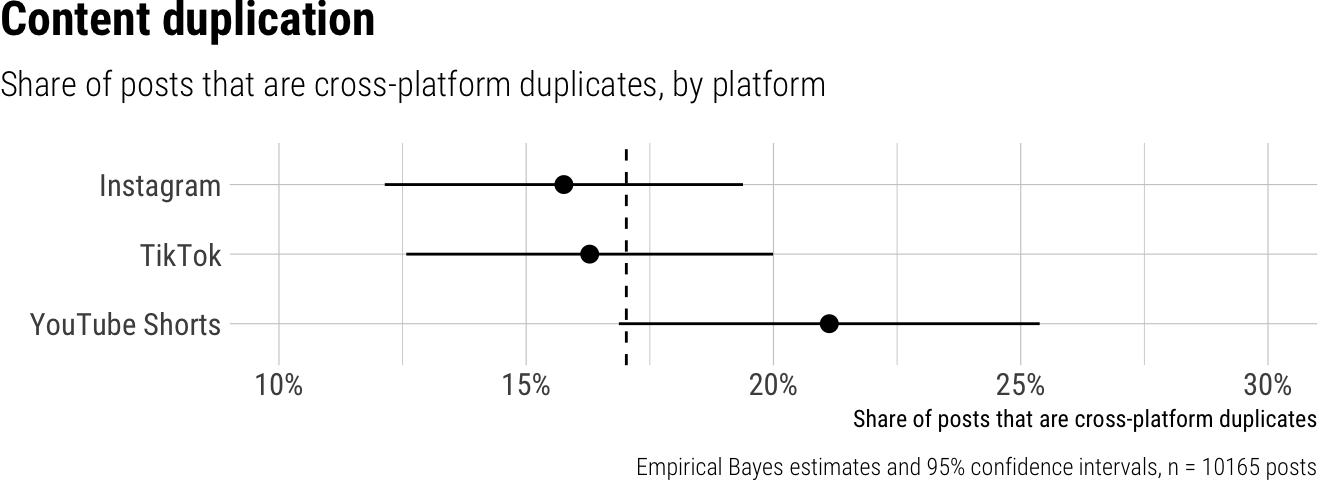
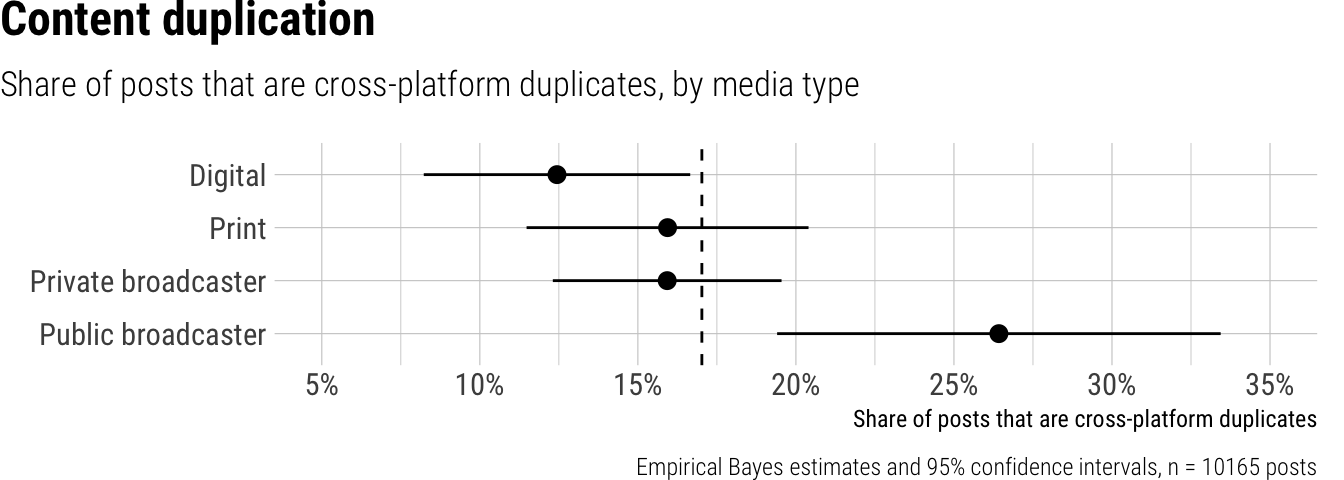
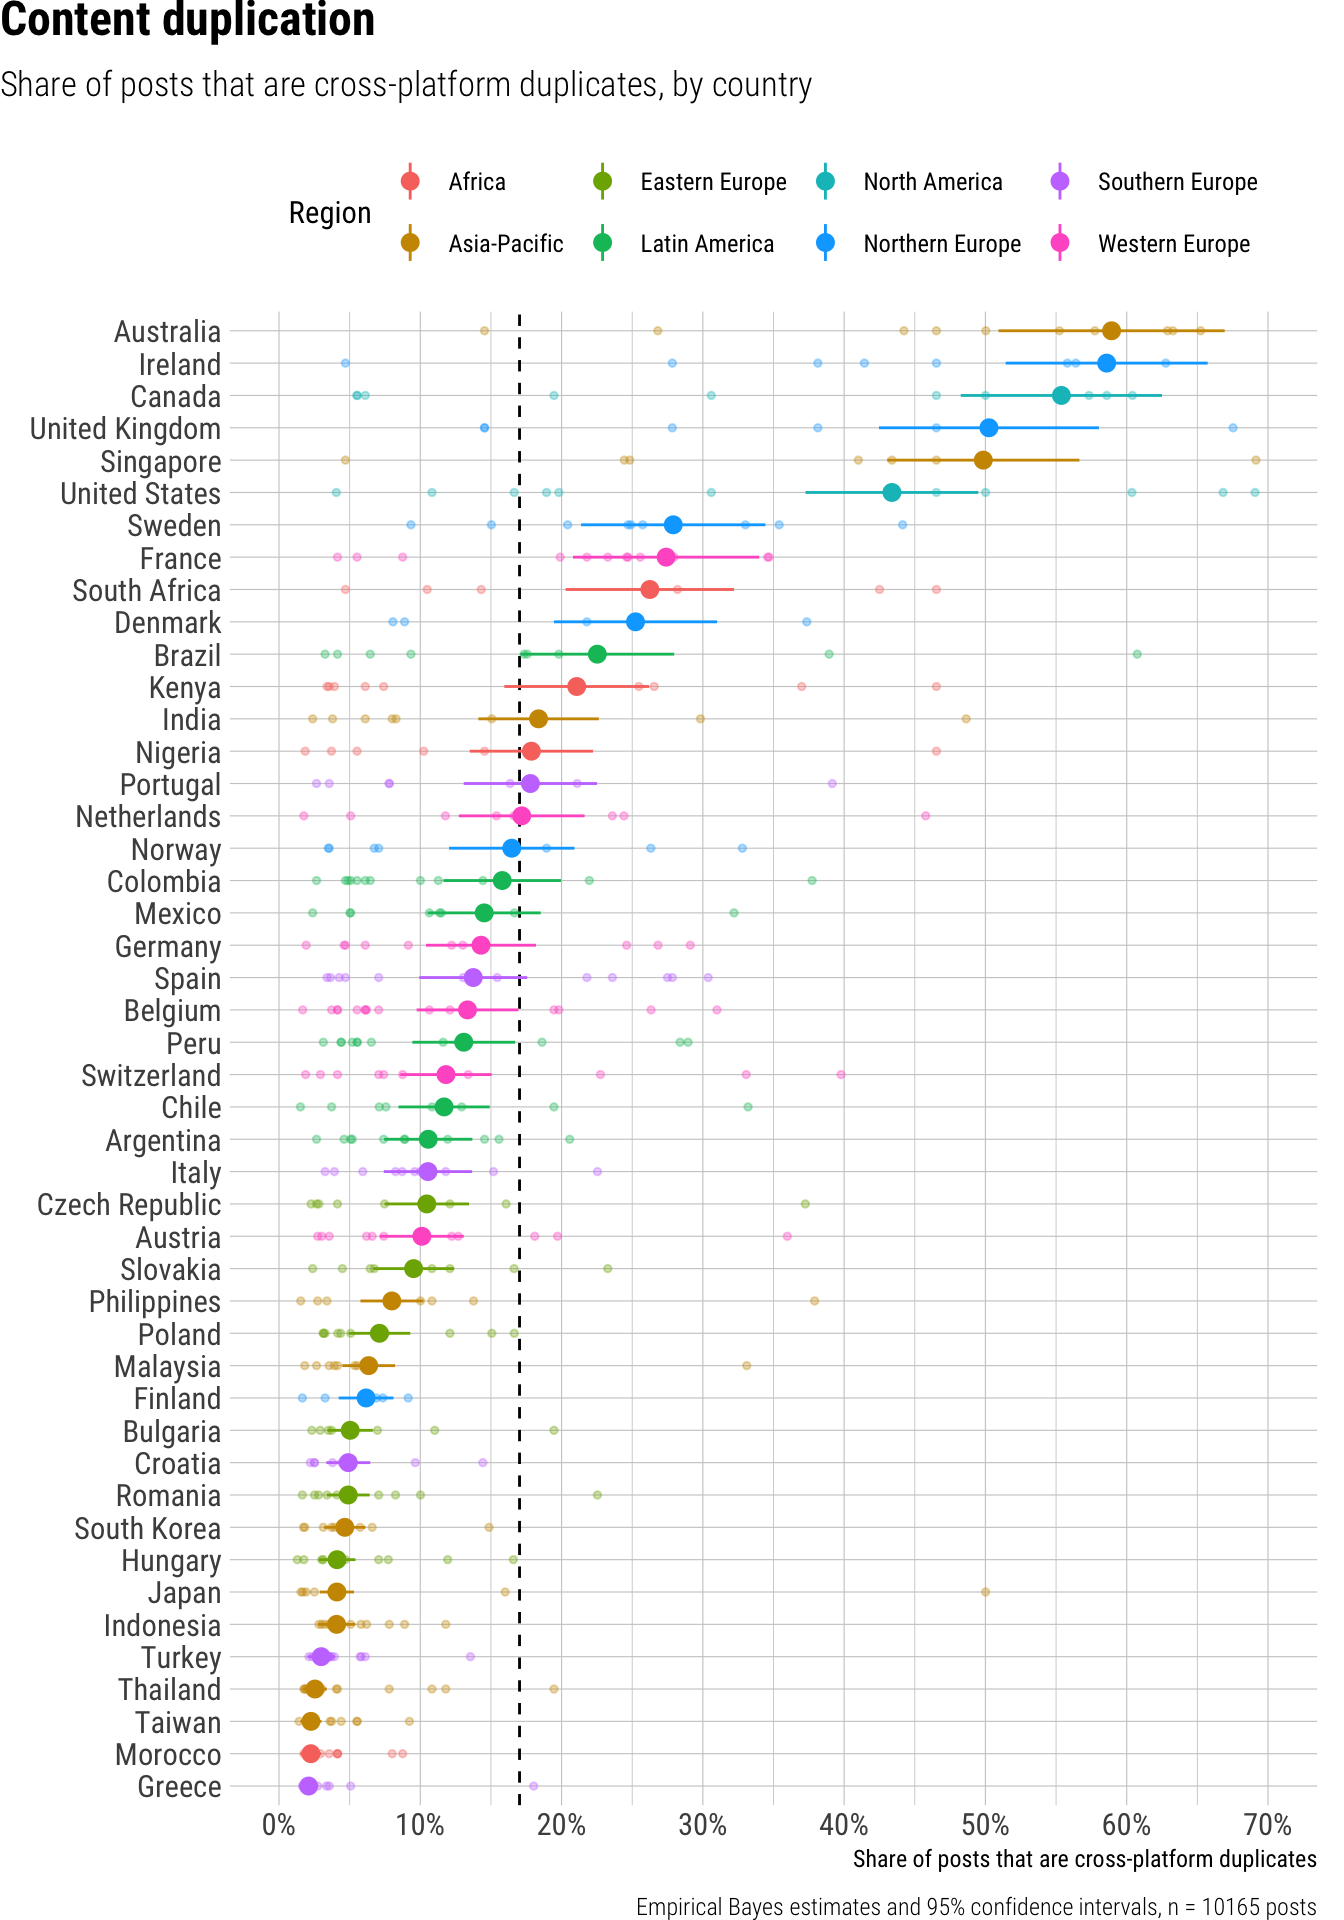
Content duplication
News outlets globally duplicated approximately 17% of their short video posts across different platforms. We observed notable differences in content duplication depending on the platform and outlet type. On platforms, YouTube Shorts had a significantly higher share of duplicated content at 21% compared to Instagram and TikTok, which both showed 16% duplication; differences between Instagram and TikTok were small and non-significant. Regarding outlet types, public broadcasters engaged in substantially more cross-platform duplication, with 26% of their posts being duplicates, a significantly higher rate than digital outlets at 12%. Differences among digital, print, and private broadcasters (which ranged from 12% to 16%) were small and non-significant without further contrast analysis. Content duplication also varied widely by country; for instance, Australia and Ireland showed the highest rates at 59%, followed by Canada at 55%, and Singapore and the United Kingdom both at 50%. In contrast, countries like Greece, Morocco, and Taiwan had the lowest rates, with only 2% of their posts being duplicates.
Result tables for Content duplication
Overall average
| estimate | p.value | conf.low | conf.high |
|---|---|---|---|
| 0.17 | 0 | 0.13 | 0.21 |
Contrasts
| term | contrast | estimate | p.value | conf.low | conf.high |
|---|---|---|---|---|---|
| outlet_type | Print - Digital | -0.02 | 0.33 | -0.07 | 0.02 |
| outlet_type | Private broadcaster - Digital | -0.04 | 0.12 | -0.08 | 0.01 |
| outlet_type | Public broadcaster - Digital | -0.02 | 0.54 | -0.07 | 0.04 |
| platform | TikTok - Instagram | -0.01 | 0.25 | -0.02 | 0.01 |
| platform | YouTube Shorts - Instagram | 0.04 | 0.00 | 0.02 | 0.06 |
Predictions by platform
| platform | estimate | p.value | conf.low | conf.high |
|---|---|---|---|---|
| 0.16 | 0 | 0.12 | 0.19 | |
| TikTok | 0.16 | 0 | 0.13 | 0.20 |
| YouTube Shorts | 0.21 | 0 | 0.17 | 0.25 |
Predictions by outlet type
| outlet_type | estimate | p.value | conf.low | conf.high |
|---|---|---|---|---|
| Digital | 0.12 | 0 | 0.08 | 0.17 |
| 0.16 | 0 | 0.11 | 0.20 | |
| Private broadcaster | 0.16 | 0 | 0.12 | 0.20 |
| Public broadcaster | 0.26 | 0 | 0.19 | 0.33 |
Predictions by country
| country | estimate | p.value | conf.low | conf.high | region |
|---|---|---|---|---|---|
| Argentina | 0.11 | 0 | 0.07 | 0.14 | Latin America |
| Australia | 0.59 | 0 | 0.51 | 0.67 | Asia-Pacific |
| Austria | 0.10 | 0 | 0.07 | 0.13 | Western Europe |
| Belgium | 0.13 | 0 | 0.10 | 0.17 | Western Europe |
| Brazil | 0.23 | 0 | 0.17 | 0.28 | Latin America |
| Bulgaria | 0.05 | 0 | 0.03 | 0.07 | Eastern Europe |
| Canada | 0.55 | 0 | 0.48 | 0.62 | North America |
| Chile | 0.12 | 0 | 0.08 | 0.15 | Latin America |
| Colombia | 0.16 | 0 | 0.12 | 0.20 | Latin America |
| Croatia | 0.05 | 0 | 0.03 | 0.06 | Southern Europe |
| Czech Republic | 0.10 | 0 | 0.07 | 0.13 | Eastern Europe |
| Denmark | 0.25 | 0 | 0.19 | 0.31 | Northern Europe |
| Finland | 0.06 | 0 | 0.04 | 0.08 | Northern Europe |
| France | 0.27 | 0 | 0.21 | 0.34 | Western Europe |
| Germany | 0.14 | 0 | 0.10 | 0.18 | Western Europe |
| Greece | 0.02 | 0 | 0.01 | 0.03 | Southern Europe |
| Hungary | 0.04 | 0 | 0.03 | 0.05 | Eastern Europe |
| India | 0.18 | 0 | 0.14 | 0.23 | Asia-Pacific |
| Indonesia | 0.04 | 0 | 0.03 | 0.05 | Asia-Pacific |
| Ireland | 0.59 | 0 | 0.51 | 0.66 | Northern Europe |
| Italy | 0.11 | 0 | 0.07 | 0.14 | Southern Europe |
| Japan | 0.04 | 0 | 0.03 | 0.05 | Asia-Pacific |
| Kenya | 0.21 | 0 | 0.16 | 0.26 | Africa |
| Malaysia | 0.06 | 0 | 0.04 | 0.08 | Asia-Pacific |
| Mexico | 0.15 | 0 | 0.11 | 0.19 | Latin America |
| Morocco | 0.02 | 0 | 0.02 | 0.03 | Africa |
| Netherlands | 0.17 | 0 | 0.13 | 0.22 | Western Europe |
| Nigeria | 0.18 | 0 | 0.13 | 0.22 | Africa |
| Norway | 0.16 | 0 | 0.12 | 0.21 | Northern Europe |
| Peru | 0.13 | 0 | 0.09 | 0.17 | Latin America |
| Philippines | 0.08 | 0 | 0.06 | 0.10 | Asia-Pacific |
| Poland | 0.07 | 0 | 0.05 | 0.09 | Eastern Europe |
| Portugal | 0.18 | 0 | 0.13 | 0.23 | Southern Europe |
| Romania | 0.05 | 0 | 0.03 | 0.06 | Eastern Europe |
| Singapore | 0.50 | 0 | 0.43 | 0.57 | Asia-Pacific |
| Slovakia | 0.10 | 0 | 0.07 | 0.12 | Eastern Europe |
| South Africa | 0.26 | 0 | 0.20 | 0.32 | Africa |
| South Korea | 0.05 | 0 | 0.03 | 0.06 | Asia-Pacific |
| Spain | 0.14 | 0 | 0.10 | 0.18 | Southern Europe |
| Sweden | 0.28 | 0 | 0.21 | 0.34 | Northern Europe |
| Switzerland | 0.12 | 0 | 0.09 | 0.15 | Western Europe |
| Taiwan | 0.02 | 0 | 0.02 | 0.03 | Asia-Pacific |
| Thailand | 0.03 | 0 | 0.02 | 0.03 | Asia-Pacific |
| Turkey | 0.03 | 0 | 0.02 | 0.04 | Southern Europe |
| United Kingdom | 0.50 | 0 | 0.42 | 0.58 | Northern Europe |
| United States | 0.43 | 0 | 0.37 | 0.49 | North America |
Measures
Video duration was provided as meta data from the platforms. Content duplication was measured by computing pairwise Jaccard distances on the post transcripts, with a threshold of .70, using the textreuse package (Mullen 2020).
References
Mullen, Lincoln. 2020. “Textreuse: Detect Text Reuse and Document Similarity.” https://doi.org/10.32614/CRAN.package.textreuse.