Note that all the summary texts on this page are currently generated automatically using a Large Language Model (Google’s Gemini), based on the results tables and other information from the data. Therefore, please do not cite the verbal summary, but refer to the figures and tables for accurate information.
Demographics
Gender proportions (image)
Across short video posts published by news outlets globally, women made up an average of 34% of visible individuals. We observed variations across platforms; for instance, YouTube Shorts featured women in 29% of visible roles, which was significantly lower than Instagram’s 34%. TikTok had the highest share at 36%, but other platform differences were not statistically significant. Regarding outlet type, public broadcasters showed the highest representation of women at 37%, followed closely by digital outlets at 36%. Private broadcasters, however, displayed a significantly lower share of visible women at 32%, a 5 percentage point drop compared to digital outlets. Print outlets fell in the middle with 33%. Country-level analysis revealed substantial variation, ranging from lows of 24% in South Korea and 27% in Hungary and Poland, to highs of 46% in Norway, 42% in Romania and Sweden, and 41% in Finland.
Contrasts
| outlet_type |
Print - Digital |
-0.03 |
0.13 |
-0.08 |
0.01 |
| outlet_type |
Private broadcaster - Digital |
-0.05 |
0.02 |
-0.09 |
-0.01 |
| outlet_type |
Public broadcaster - Digital |
-0.01 |
0.81 |
-0.06 |
0.05 |
| platform |
TikTok - Instagram |
0.01 |
0.56 |
-0.02 |
0.03 |
| platform |
YouTube Shorts - Instagram |
-0.04 |
0.00 |
-0.08 |
-0.01 |
Predictions by outlet type
| Digital |
0.36 |
0 |
0.32 |
0.40 |
| Print |
0.33 |
0 |
0.30 |
0.36 |
| Private broadcaster |
0.32 |
0 |
0.30 |
0.34 |
| Public broadcaster |
0.37 |
0 |
0.33 |
0.41 |
Predictions by country
| Argentina |
0.32 |
0 |
0.30 |
0.34 |
Latin America |
| Australia |
0.33 |
0 |
0.32 |
0.35 |
Asia-Pacific |
| Austria |
0.36 |
0 |
0.34 |
0.38 |
Western Europe |
| Belgium |
0.32 |
0 |
0.30 |
0.34 |
Western Europe |
| Brazil |
0.33 |
0 |
0.32 |
0.35 |
Latin America |
| Bulgaria |
0.33 |
0 |
0.31 |
0.34 |
Eastern Europe |
| Canada |
0.35 |
0 |
0.33 |
0.37 |
North America |
| Chile |
0.35 |
0 |
0.33 |
0.37 |
Latin America |
| Colombia |
0.31 |
0 |
0.30 |
0.33 |
Latin America |
| Croatia |
0.38 |
0 |
0.36 |
0.40 |
Southern Europe |
| Czech Republic |
0.32 |
0 |
0.30 |
0.34 |
Eastern Europe |
| Denmark |
0.37 |
0 |
0.35 |
0.39 |
Northern Europe |
| Finland |
0.41 |
0 |
0.39 |
0.43 |
Northern Europe |
| France |
0.31 |
0 |
0.29 |
0.32 |
Western Europe |
| Germany |
0.36 |
0 |
0.34 |
0.37 |
Western Europe |
| Greece |
0.37 |
0 |
0.36 |
0.39 |
Southern Europe |
| Hungary |
0.27 |
0 |
0.25 |
0.28 |
Eastern Europe |
| India |
0.28 |
0 |
0.27 |
0.30 |
Asia-Pacific |
| Indonesia |
0.32 |
0 |
0.30 |
0.33 |
Asia-Pacific |
| Ireland |
0.34 |
0 |
0.33 |
0.36 |
Northern Europe |
| Italy |
0.32 |
0 |
0.30 |
0.34 |
Southern Europe |
| Japan |
0.31 |
0 |
0.29 |
0.32 |
Asia-Pacific |
| Kenya |
0.34 |
0 |
0.32 |
0.36 |
Africa |
| Malaysia |
0.29 |
0 |
0.27 |
0.31 |
Asia-Pacific |
| Mexico |
0.32 |
0 |
0.31 |
0.34 |
Latin America |
| Morocco |
0.30 |
0 |
0.29 |
0.32 |
Africa |
| Netherlands |
0.35 |
0 |
0.33 |
0.37 |
Western Europe |
| Nigeria |
0.34 |
0 |
0.32 |
0.35 |
Africa |
| Norway |
0.46 |
0 |
0.44 |
0.48 |
Northern Europe |
| Peru |
0.32 |
0 |
0.30 |
0.33 |
Latin America |
| Philippines |
0.39 |
0 |
0.37 |
0.40 |
Asia-Pacific |
| Poland |
0.27 |
0 |
0.26 |
0.29 |
Eastern Europe |
| Portugal |
0.38 |
0 |
0.36 |
0.40 |
Southern Europe |
| Romania |
0.42 |
0 |
0.40 |
0.44 |
Eastern Europe |
| Singapore |
0.32 |
0 |
0.31 |
0.34 |
Asia-Pacific |
| Slovakia |
0.38 |
0 |
0.36 |
0.40 |
Eastern Europe |
| South Africa |
0.33 |
0 |
0.31 |
0.35 |
Africa |
| South Korea |
0.24 |
0 |
0.23 |
0.26 |
Asia-Pacific |
| Spain |
0.33 |
0 |
0.31 |
0.35 |
Southern Europe |
| Sweden |
0.42 |
0 |
0.40 |
0.44 |
Northern Europe |
| Switzerland |
0.37 |
0 |
0.35 |
0.38 |
Western Europe |
| Taiwan |
0.30 |
0 |
0.28 |
0.32 |
Asia-Pacific |
| Thailand |
0.34 |
0 |
0.32 |
0.35 |
Asia-Pacific |
| Turkey |
0.28 |
0 |
0.27 |
0.30 |
Southern Europe |
| United Kingdom |
0.32 |
0 |
0.31 |
0.34 |
Northern Europe |
| United States |
0.34 |
0 |
0.32 |
0.36 |
North America |
Gender proportions (speech)
Across all short video posts published by news outlets, women spoke in an average of 41% of the video content. Differences in the share of women speaking across platforms were small and not statistically significant. However, looking at outlet types, private broadcasters featured women speaking in 39% of their videos, a significantly lower share compared to both digital outlets and public broadcasters, which each featured women in 43% of their videos. Print outlets showed women speaking in 41% of their videos, which was not significantly different from the other types. The representation of women speaking varied considerably by country, ranging from a low of 28% in Poland to a high of 56% in Norway, with Japan and Sweden also featuring women in 50% of their videos.
Contrasts
| outlet_type |
Print - Digital |
-0.05 |
0.07 |
-0.09 |
0.00 |
| outlet_type |
Private broadcaster - Digital |
-0.06 |
0.02 |
-0.10 |
-0.01 |
| outlet_type |
Public broadcaster - Digital |
-0.03 |
0.31 |
-0.09 |
0.03 |
| platform |
TikTok - Instagram |
0.02 |
0.12 |
-0.01 |
0.04 |
| platform |
YouTube Shorts - Instagram |
0.02 |
0.24 |
-0.01 |
0.05 |
Predictions by outlet type
| Digital |
0.43 |
0 |
0.39 |
0.48 |
| Print |
0.41 |
0 |
0.37 |
0.44 |
| Private broadcaster |
0.39 |
0 |
0.36 |
0.42 |
| Public broadcaster |
0.43 |
0 |
0.38 |
0.48 |
Predictions by country
| Argentina |
0.37 |
0 |
0.35 |
0.40 |
Latin America |
| Australia |
0.44 |
0 |
0.41 |
0.47 |
Asia-Pacific |
| Austria |
0.42 |
0 |
0.40 |
0.45 |
Western Europe |
| Belgium |
0.37 |
0 |
0.35 |
0.40 |
Western Europe |
| Brazil |
0.39 |
0 |
0.36 |
0.41 |
Latin America |
| Bulgaria |
0.39 |
0 |
0.37 |
0.42 |
Eastern Europe |
| Canada |
0.41 |
0 |
0.38 |
0.43 |
North America |
| Chile |
0.40 |
0 |
0.38 |
0.43 |
Latin America |
| Colombia |
0.38 |
0 |
0.36 |
0.41 |
Latin America |
| Croatia |
0.39 |
0 |
0.36 |
0.41 |
Southern Europe |
| Czech Republic |
0.35 |
0 |
0.33 |
0.38 |
Eastern Europe |
| Denmark |
0.32 |
0 |
0.30 |
0.34 |
Northern Europe |
| Finland |
0.47 |
0 |
0.44 |
0.50 |
Northern Europe |
| France |
0.43 |
0 |
0.41 |
0.46 |
Western Europe |
| Germany |
0.45 |
0 |
0.43 |
0.48 |
Western Europe |
| Greece |
0.37 |
0 |
0.35 |
0.40 |
Southern Europe |
| Hungary |
0.33 |
0 |
0.31 |
0.35 |
Eastern Europe |
| India |
0.35 |
0 |
0.32 |
0.37 |
Asia-Pacific |
| Indonesia |
0.45 |
0 |
0.43 |
0.48 |
Asia-Pacific |
| Ireland |
0.41 |
0 |
0.39 |
0.44 |
Northern Europe |
| Italy |
0.34 |
0 |
0.32 |
0.36 |
Southern Europe |
| Japan |
0.50 |
0 |
0.47 |
0.52 |
Asia-Pacific |
| Kenya |
0.35 |
0 |
0.33 |
0.38 |
Africa |
| Malaysia |
0.49 |
0 |
0.47 |
0.52 |
Asia-Pacific |
| Mexico |
0.43 |
0 |
0.40 |
0.45 |
Latin America |
| Morocco |
0.32 |
0 |
0.30 |
0.35 |
Africa |
| Netherlands |
0.40 |
0 |
0.38 |
0.43 |
Western Europe |
| Nigeria |
0.36 |
0 |
0.34 |
0.38 |
Africa |
| Norway |
0.56 |
0 |
0.53 |
0.59 |
Northern Europe |
| Peru |
0.38 |
0 |
0.35 |
0.40 |
Latin America |
| Philippines |
0.47 |
0 |
0.44 |
0.49 |
Asia-Pacific |
| Poland |
0.28 |
0 |
0.26 |
0.30 |
Eastern Europe |
| Portugal |
0.44 |
0 |
0.42 |
0.47 |
Southern Europe |
| Romania |
0.45 |
0 |
0.42 |
0.47 |
Eastern Europe |
| Singapore |
0.39 |
0 |
0.36 |
0.41 |
Asia-Pacific |
| Slovakia |
0.36 |
0 |
0.34 |
0.39 |
Eastern Europe |
| South Africa |
0.44 |
0 |
0.41 |
0.46 |
Africa |
| South Korea |
0.39 |
0 |
0.37 |
0.41 |
Asia-Pacific |
| Spain |
0.36 |
0 |
0.34 |
0.39 |
Southern Europe |
| Sweden |
0.50 |
0 |
0.47 |
0.52 |
Northern Europe |
| Switzerland |
0.48 |
0 |
0.46 |
0.51 |
Western Europe |
| Taiwan |
0.40 |
0 |
0.38 |
0.43 |
Asia-Pacific |
| Thailand |
0.48 |
0 |
0.46 |
0.51 |
Asia-Pacific |
| Turkey |
0.29 |
0 |
0.27 |
0.31 |
Southern Europe |
| United Kingdom |
0.40 |
0 |
0.37 |
0.42 |
Northern Europe |
| United States |
0.44 |
0 |
0.42 |
0.47 |
North America |
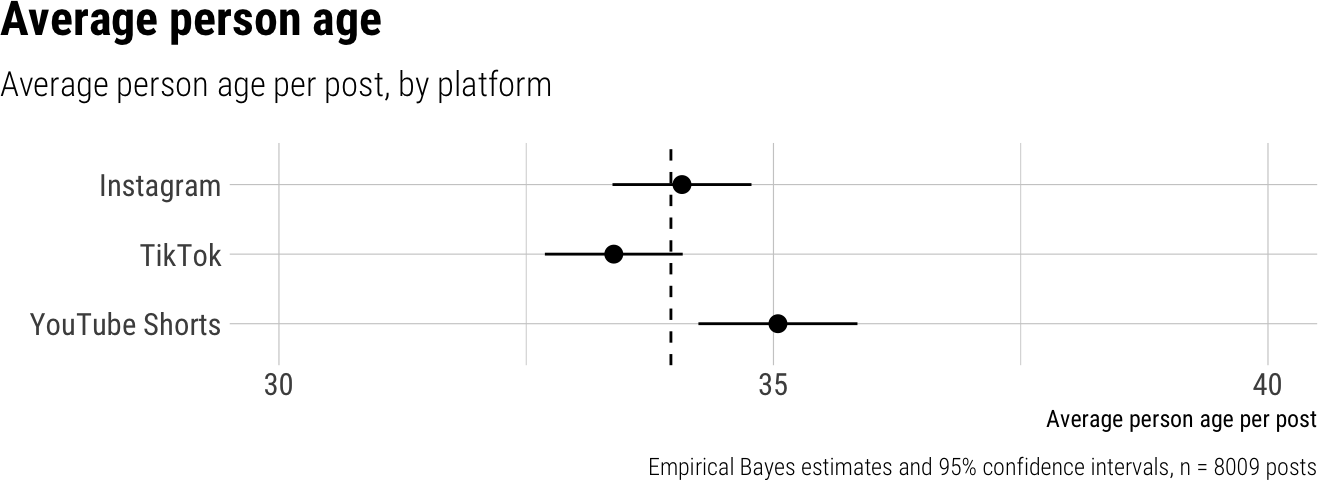
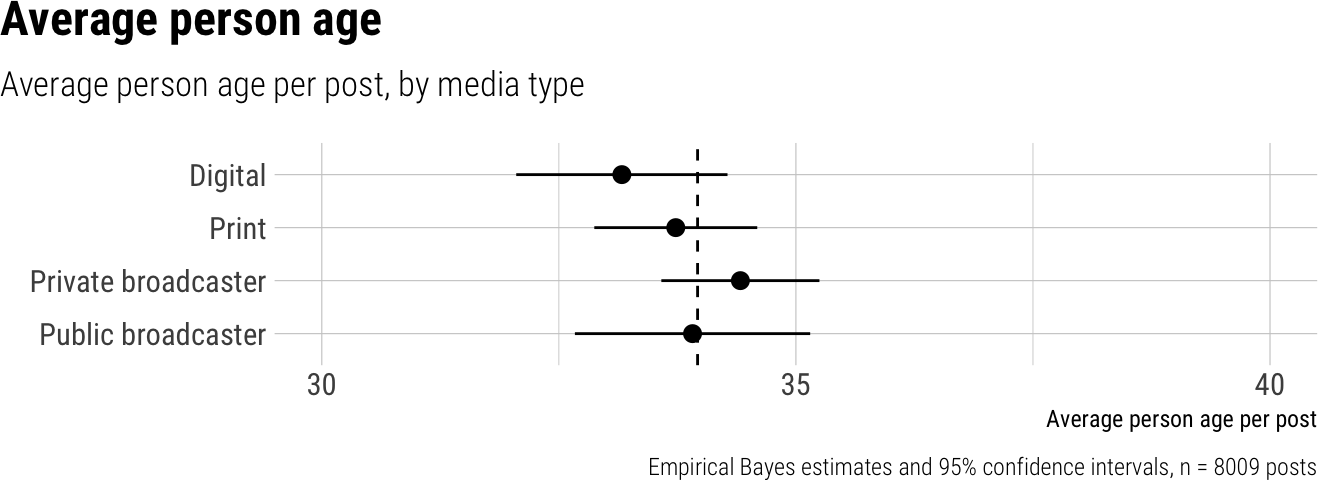
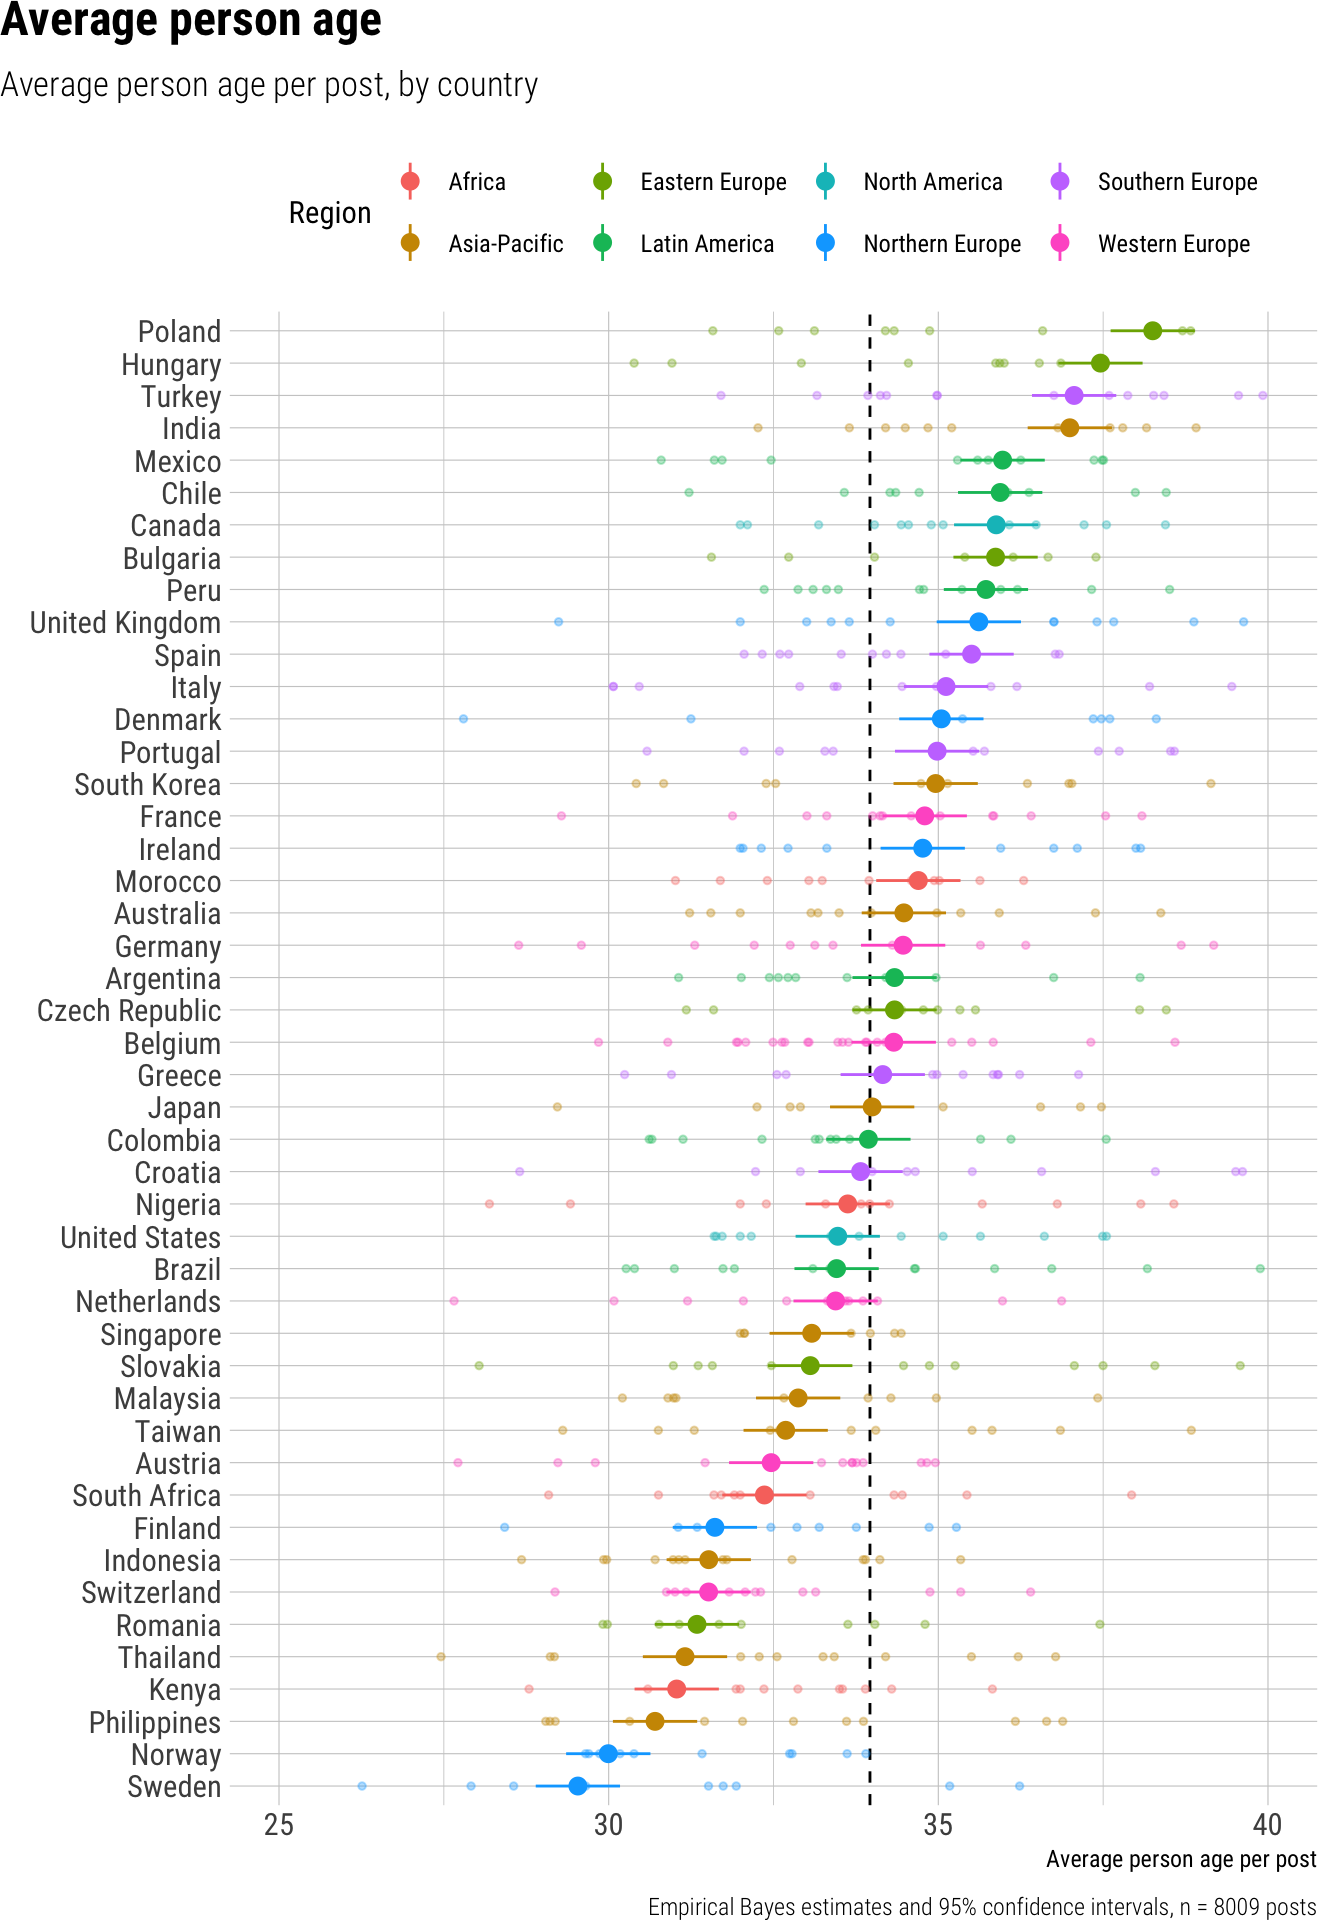
Average person age
Across all platforms, news outlets worldwide featured individuals averaging 34 years old in their short video posts. Examining specific platforms, we observed that YouTube Shorts featured individuals with an average age of 35.1 years, which was significantly older than those on Instagram, averaging 34.1 years; TikTok videos featured individuals averaging 33.4 years. We found that differences in the average age of individuals across various outlet types—digital, print, private broadcaster, and public broadcaster—were minor and not statistically significant. A considerable variation emerged across countries, with the average age of persons featured ranging from as young as 29.5 years in Sweden and 30.0 years in Norway, to as old as 38.3 years in Poland and 37.5 years in Hungary.
Contrasts
| outlet_type |
Print - Digital |
0.76 |
0.23 |
-0.47 |
1.99 |
| outlet_type |
Private broadcaster - Digital |
0.94 |
0.13 |
-0.27 |
2.15 |
| outlet_type |
Public broadcaster - Digital |
1.30 |
0.09 |
-0.22 |
2.82 |
| platform |
TikTok - Instagram |
-0.49 |
0.07 |
-1.01 |
0.03 |
| platform |
YouTube Shorts - Instagram |
0.92 |
0.01 |
0.25 |
1.58 |
Predictions by outlet type
| Digital |
33.16 |
0 |
32.05 |
34.28 |
| Print |
33.73 |
0 |
32.87 |
34.59 |
| Private broadcaster |
34.41 |
0 |
33.58 |
35.25 |
| Public broadcaster |
33.91 |
0 |
32.67 |
35.15 |
Predictions by country
| Argentina |
34.34 |
0 |
33.70 |
34.98 |
Latin America |
| Australia |
34.48 |
0 |
33.84 |
35.12 |
Asia-Pacific |
| Austria |
32.47 |
0 |
31.83 |
33.10 |
Western Europe |
| Belgium |
34.32 |
0 |
33.68 |
34.96 |
Western Europe |
| Brazil |
33.46 |
0 |
32.82 |
34.10 |
Latin America |
| Bulgaria |
35.87 |
0 |
35.23 |
36.51 |
Eastern Europe |
| Canada |
35.88 |
0 |
35.24 |
36.52 |
North America |
| Chile |
35.94 |
0 |
35.30 |
36.58 |
Latin America |
| Colombia |
33.94 |
0 |
33.30 |
34.58 |
Latin America |
| Croatia |
33.82 |
0 |
33.18 |
34.46 |
Southern Europe |
| Czech Republic |
34.34 |
0 |
33.70 |
34.98 |
Eastern Europe |
| Denmark |
35.05 |
0 |
34.41 |
35.69 |
Northern Europe |
| Finland |
31.61 |
0 |
30.97 |
32.25 |
Northern Europe |
| France |
34.79 |
0 |
34.15 |
35.43 |
Western Europe |
| Germany |
34.47 |
0 |
33.83 |
35.11 |
Western Europe |
| Greece |
34.16 |
0 |
33.52 |
34.80 |
Southern Europe |
| Hungary |
37.46 |
0 |
36.82 |
38.10 |
Eastern Europe |
| India |
36.99 |
0 |
36.36 |
37.63 |
Asia-Pacific |
| Indonesia |
31.52 |
0 |
30.88 |
32.16 |
Asia-Pacific |
| Ireland |
34.76 |
0 |
34.12 |
35.40 |
Northern Europe |
| Italy |
35.12 |
0 |
34.48 |
35.76 |
Southern Europe |
| Japan |
34.00 |
0 |
33.36 |
34.64 |
Asia-Pacific |
| Kenya |
31.03 |
0 |
30.39 |
31.67 |
Africa |
| Malaysia |
32.87 |
0 |
32.23 |
33.51 |
Asia-Pacific |
| Mexico |
35.98 |
0 |
35.34 |
36.61 |
Latin America |
| Morocco |
34.70 |
0 |
34.06 |
35.34 |
Africa |
| Netherlands |
33.44 |
0 |
32.80 |
34.08 |
Western Europe |
| Nigeria |
33.63 |
0 |
32.99 |
34.27 |
Africa |
| Norway |
29.99 |
0 |
29.36 |
30.63 |
Northern Europe |
| Peru |
35.72 |
0 |
35.08 |
36.36 |
Latin America |
| Philippines |
30.70 |
0 |
30.06 |
31.34 |
Asia-Pacific |
| Poland |
38.25 |
0 |
37.61 |
38.89 |
Eastern Europe |
| Portugal |
34.98 |
0 |
34.34 |
35.62 |
Southern Europe |
| Romania |
31.34 |
0 |
30.70 |
31.98 |
Eastern Europe |
| Singapore |
33.08 |
0 |
32.44 |
33.72 |
Asia-Pacific |
| Slovakia |
33.06 |
0 |
32.42 |
33.70 |
Eastern Europe |
| South Africa |
32.36 |
0 |
31.72 |
33.00 |
Africa |
| South Korea |
34.96 |
0 |
34.32 |
35.60 |
Asia-Pacific |
| Spain |
35.50 |
0 |
34.87 |
36.14 |
Southern Europe |
| Sweden |
29.53 |
0 |
28.89 |
30.17 |
Northern Europe |
| Switzerland |
31.52 |
0 |
30.88 |
32.16 |
Western Europe |
| Taiwan |
32.68 |
0 |
32.05 |
33.32 |
Asia-Pacific |
| Thailand |
31.16 |
0 |
30.52 |
31.80 |
Asia-Pacific |
| Turkey |
37.06 |
0 |
36.42 |
37.70 |
Southern Europe |
| United Kingdom |
35.61 |
0 |
34.98 |
36.25 |
Northern Europe |
| United States |
33.47 |
0 |
32.84 |
34.11 |
North America |
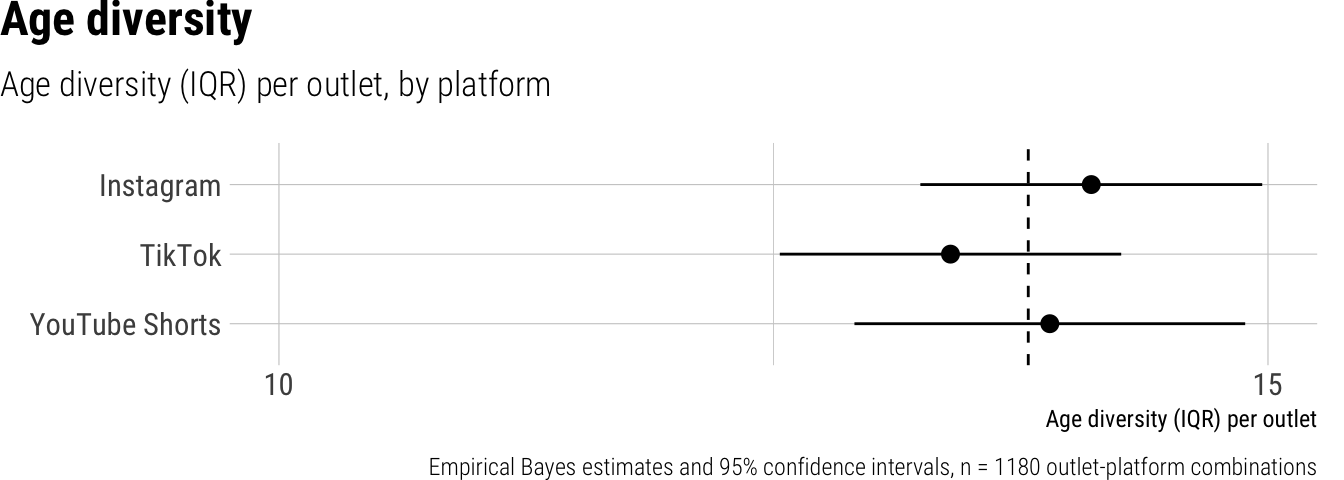
Age diversity
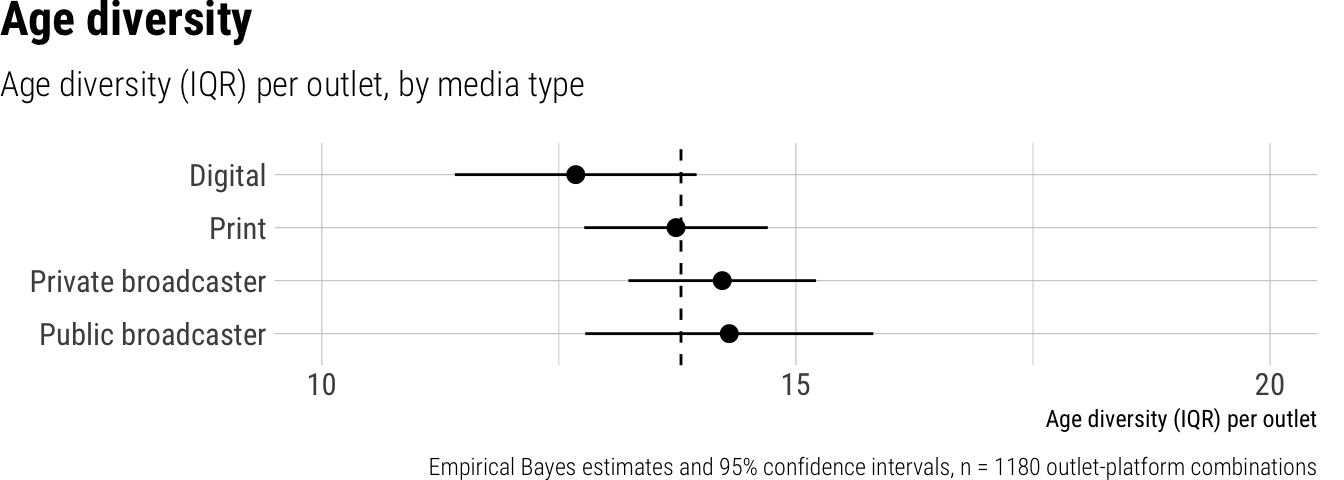
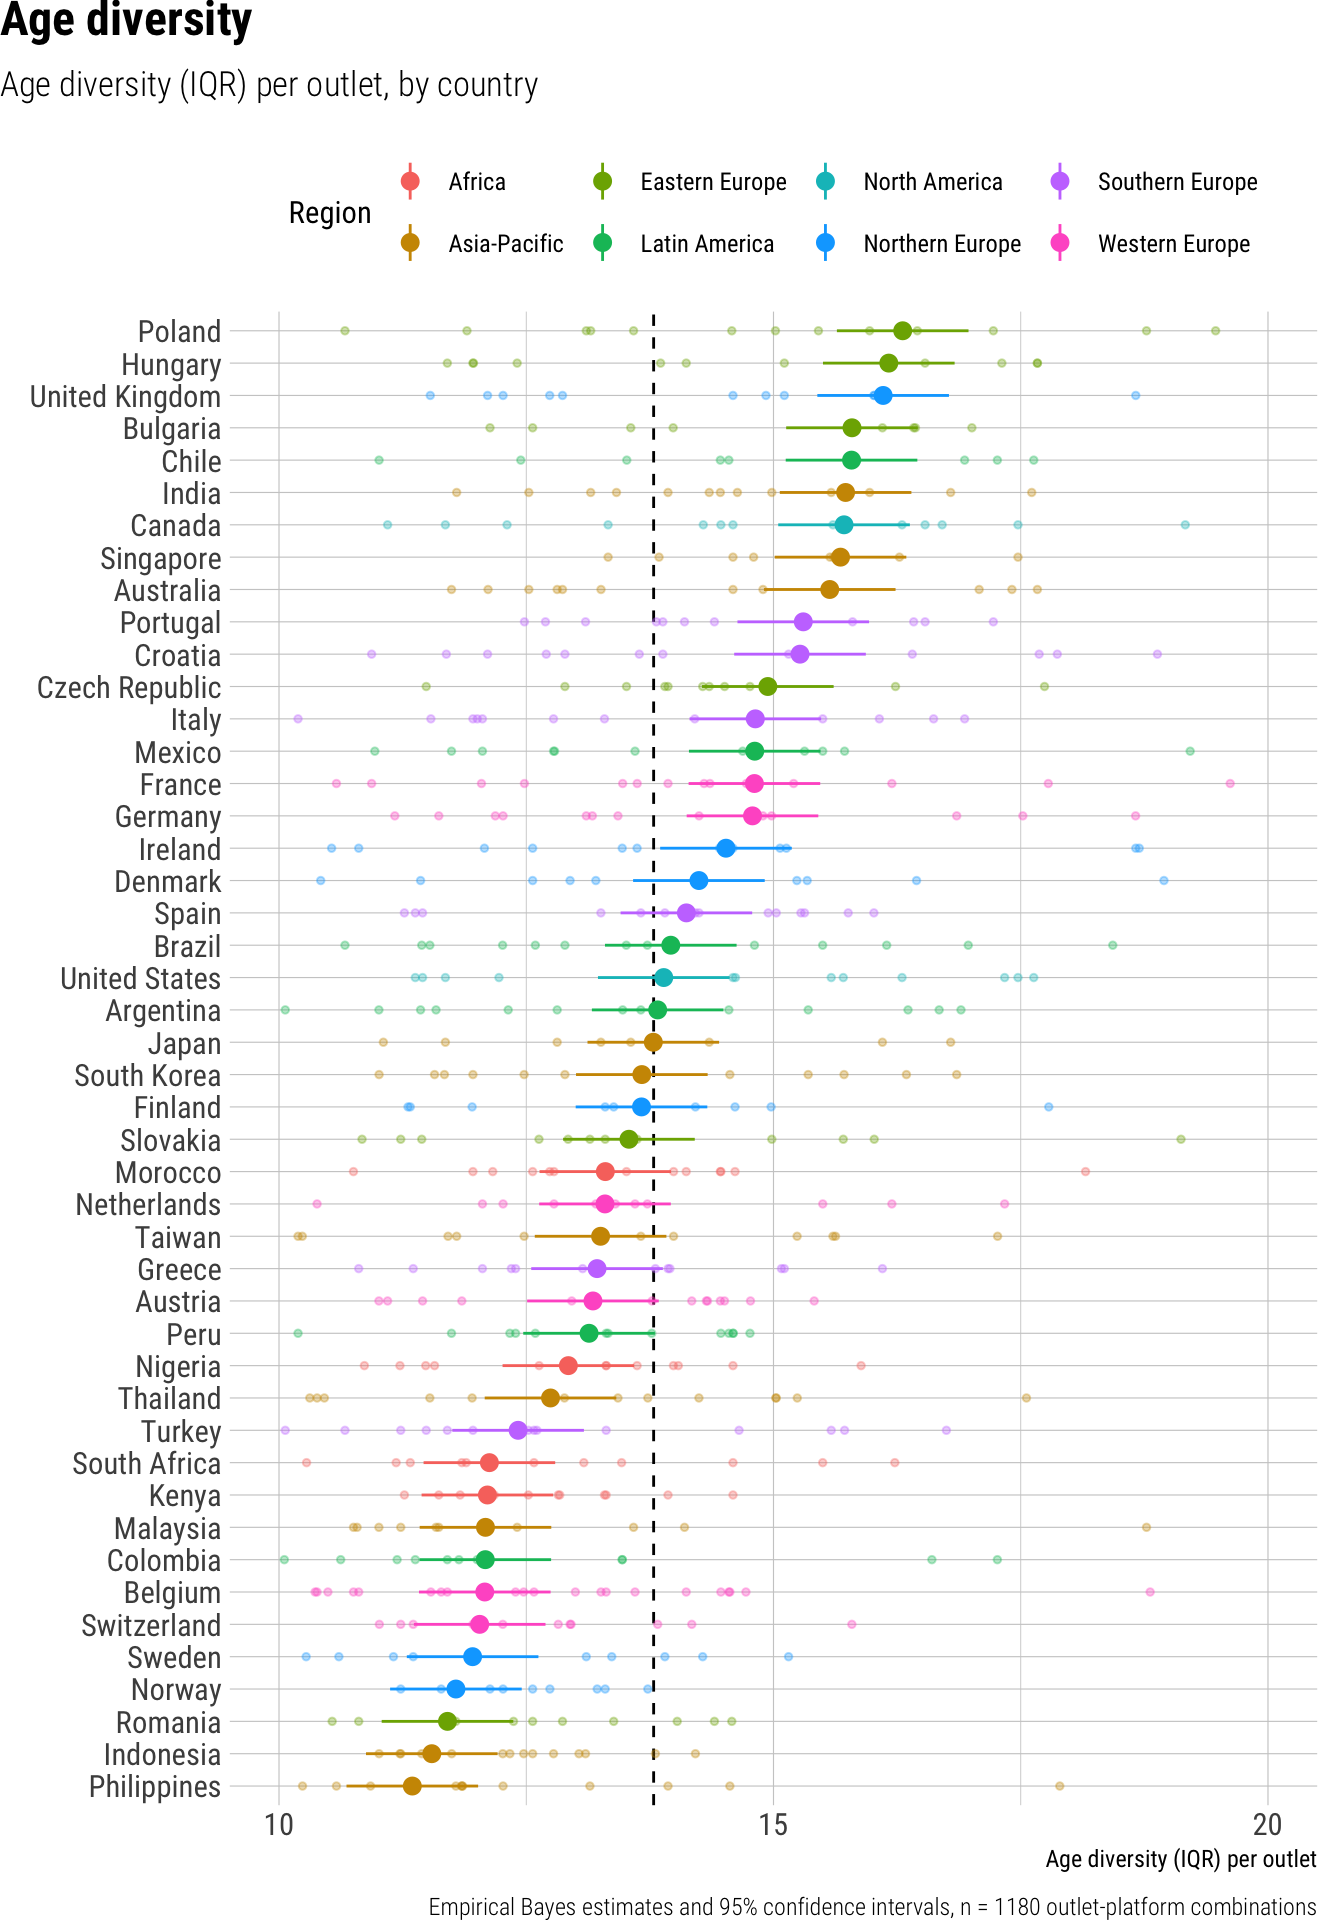
The overall average age diversity, measured by the interquartile range (IQR) of visible people’s ages in news video posts, was 13.8 years. While we observed slight variations, differences in age diversity across platforms like Instagram (14.1 years), TikTok (13.4 years), and YouTube Shorts (13.9 years) were small and not statistically significant. However, age diversity varied significantly depending on the type of news outlet. Private broadcasters presented videos with higher age diversity, averaging 14.2 years, which was a statistically significant 1.8 years greater than digital-native outlets, which averaged 12.7 years. Print outlets (13.7 years) and public broadcasters (14.3 years) showed age diversity comparable to private broadcasters, but no other significant contrasts were identified. Furthermore, age diversity varied considerably across countries, ranging from a low of 11.4 years in the Philippines to a high of 16.3 years in Poland.
Contrasts
| outlet_type |
Print - Digital |
1.32 |
0.08 |
-0.16 |
2.80 |
| outlet_type |
Private broadcaster - Digital |
1.76 |
0.02 |
0.27 |
3.25 |
| outlet_type |
Public broadcaster - Digital |
1.74 |
0.07 |
-0.14 |
3.63 |
| platform |
TikTok - Instagram |
-0.77 |
0.12 |
-1.74 |
0.19 |
| platform |
YouTube Shorts - Instagram |
-0.40 |
0.46 |
-1.48 |
0.67 |
Predictions by outlet type
| Digital |
12.68 |
0 |
11.40 |
13.95 |
| Print |
13.74 |
0 |
12.77 |
14.70 |
| Private broadcaster |
14.22 |
0 |
13.23 |
15.21 |
| Public broadcaster |
14.30 |
0 |
12.78 |
15.82 |
Predictions by country
| Argentina |
13.83 |
0 |
13.16 |
14.49 |
Latin America |
| Australia |
15.57 |
0 |
14.90 |
16.23 |
Asia-Pacific |
| Austria |
13.17 |
0 |
12.51 |
13.84 |
Western Europe |
| Belgium |
12.08 |
0 |
11.42 |
12.75 |
Western Europe |
| Brazil |
13.96 |
0 |
13.30 |
14.63 |
Latin America |
| Bulgaria |
15.79 |
0 |
15.13 |
16.46 |
Eastern Europe |
| Canada |
15.71 |
0 |
15.05 |
16.38 |
North America |
| Chile |
15.79 |
0 |
15.12 |
16.45 |
Latin America |
| Colombia |
12.09 |
0 |
11.42 |
12.75 |
Latin America |
| Croatia |
15.27 |
0 |
14.60 |
15.93 |
Southern Europe |
| Czech Republic |
14.94 |
0 |
14.28 |
15.61 |
Eastern Europe |
| Denmark |
14.25 |
0 |
13.58 |
14.91 |
Northern Europe |
| Finland |
13.67 |
0 |
13.00 |
14.33 |
Northern Europe |
| France |
14.81 |
0 |
14.14 |
15.47 |
Western Europe |
| Germany |
14.79 |
0 |
14.12 |
15.45 |
Western Europe |
| Greece |
13.22 |
0 |
12.55 |
13.88 |
Southern Europe |
| Hungary |
16.17 |
0 |
15.50 |
16.83 |
Eastern Europe |
| India |
15.73 |
0 |
15.06 |
16.39 |
Asia-Pacific |
| Indonesia |
11.55 |
0 |
10.88 |
12.21 |
Asia-Pacific |
| Ireland |
14.52 |
0 |
13.85 |
15.18 |
Northern Europe |
| Italy |
14.82 |
0 |
14.15 |
15.48 |
Southern Europe |
| Japan |
13.78 |
0 |
13.12 |
14.45 |
Asia-Pacific |
| Kenya |
12.11 |
0 |
11.44 |
12.77 |
Africa |
| Malaysia |
12.09 |
0 |
11.42 |
12.75 |
Asia-Pacific |
| Mexico |
14.81 |
0 |
14.14 |
15.48 |
Latin America |
| Morocco |
13.30 |
0 |
12.63 |
13.97 |
Africa |
| Netherlands |
13.30 |
0 |
12.63 |
13.96 |
Western Europe |
| Nigeria |
12.93 |
0 |
12.26 |
13.59 |
Africa |
| Norway |
11.79 |
0 |
11.12 |
12.45 |
Northern Europe |
| Peru |
13.14 |
0 |
12.47 |
13.80 |
Latin America |
| Philippines |
11.35 |
0 |
10.68 |
12.01 |
Asia-Pacific |
| Poland |
16.31 |
0 |
15.64 |
16.97 |
Eastern Europe |
| Portugal |
15.30 |
0 |
14.64 |
15.97 |
Southern Europe |
| Romania |
11.70 |
0 |
11.04 |
12.37 |
Eastern Europe |
| Singapore |
15.68 |
0 |
15.01 |
16.34 |
Asia-Pacific |
| Slovakia |
13.54 |
0 |
12.87 |
14.20 |
Eastern Europe |
| South Africa |
12.13 |
0 |
11.46 |
12.79 |
Africa |
| South Korea |
13.67 |
0 |
13.00 |
14.33 |
Asia-Pacific |
| Spain |
14.12 |
0 |
13.45 |
14.78 |
Southern Europe |
| Sweden |
11.96 |
0 |
11.29 |
12.62 |
Northern Europe |
| Switzerland |
12.03 |
0 |
11.36 |
12.69 |
Western Europe |
| Taiwan |
13.25 |
0 |
12.59 |
13.92 |
Asia-Pacific |
| Thailand |
12.75 |
0 |
12.08 |
13.41 |
Asia-Pacific |
| Turkey |
12.42 |
0 |
11.75 |
13.08 |
Southern Europe |
| United Kingdom |
16.11 |
0 |
15.44 |
16.77 |
Northern Europe |
| United States |
13.89 |
0 |
13.23 |
14.56 |
North America |
Content
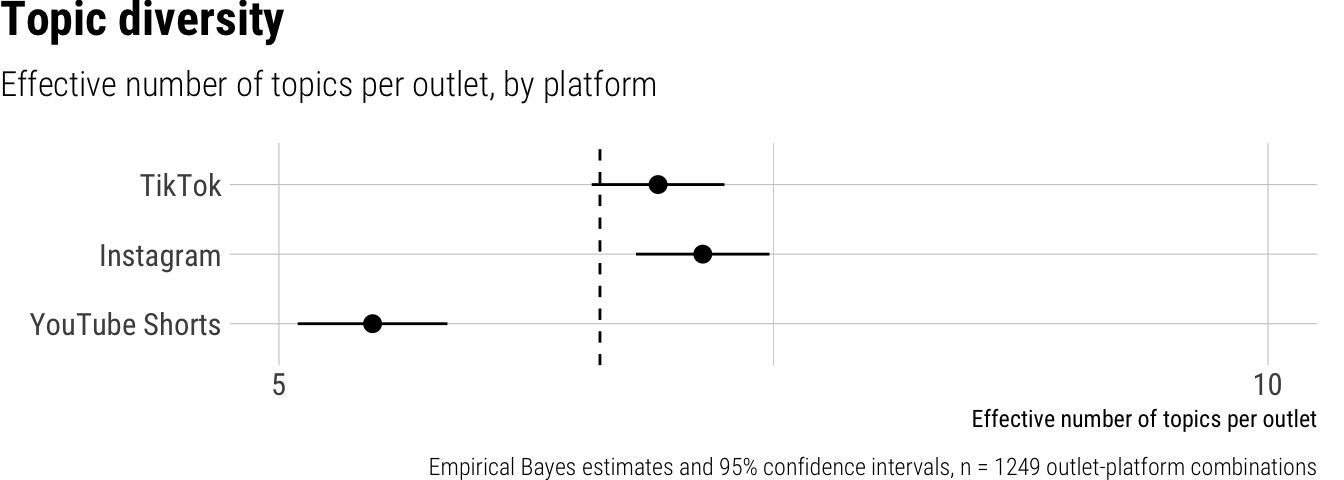
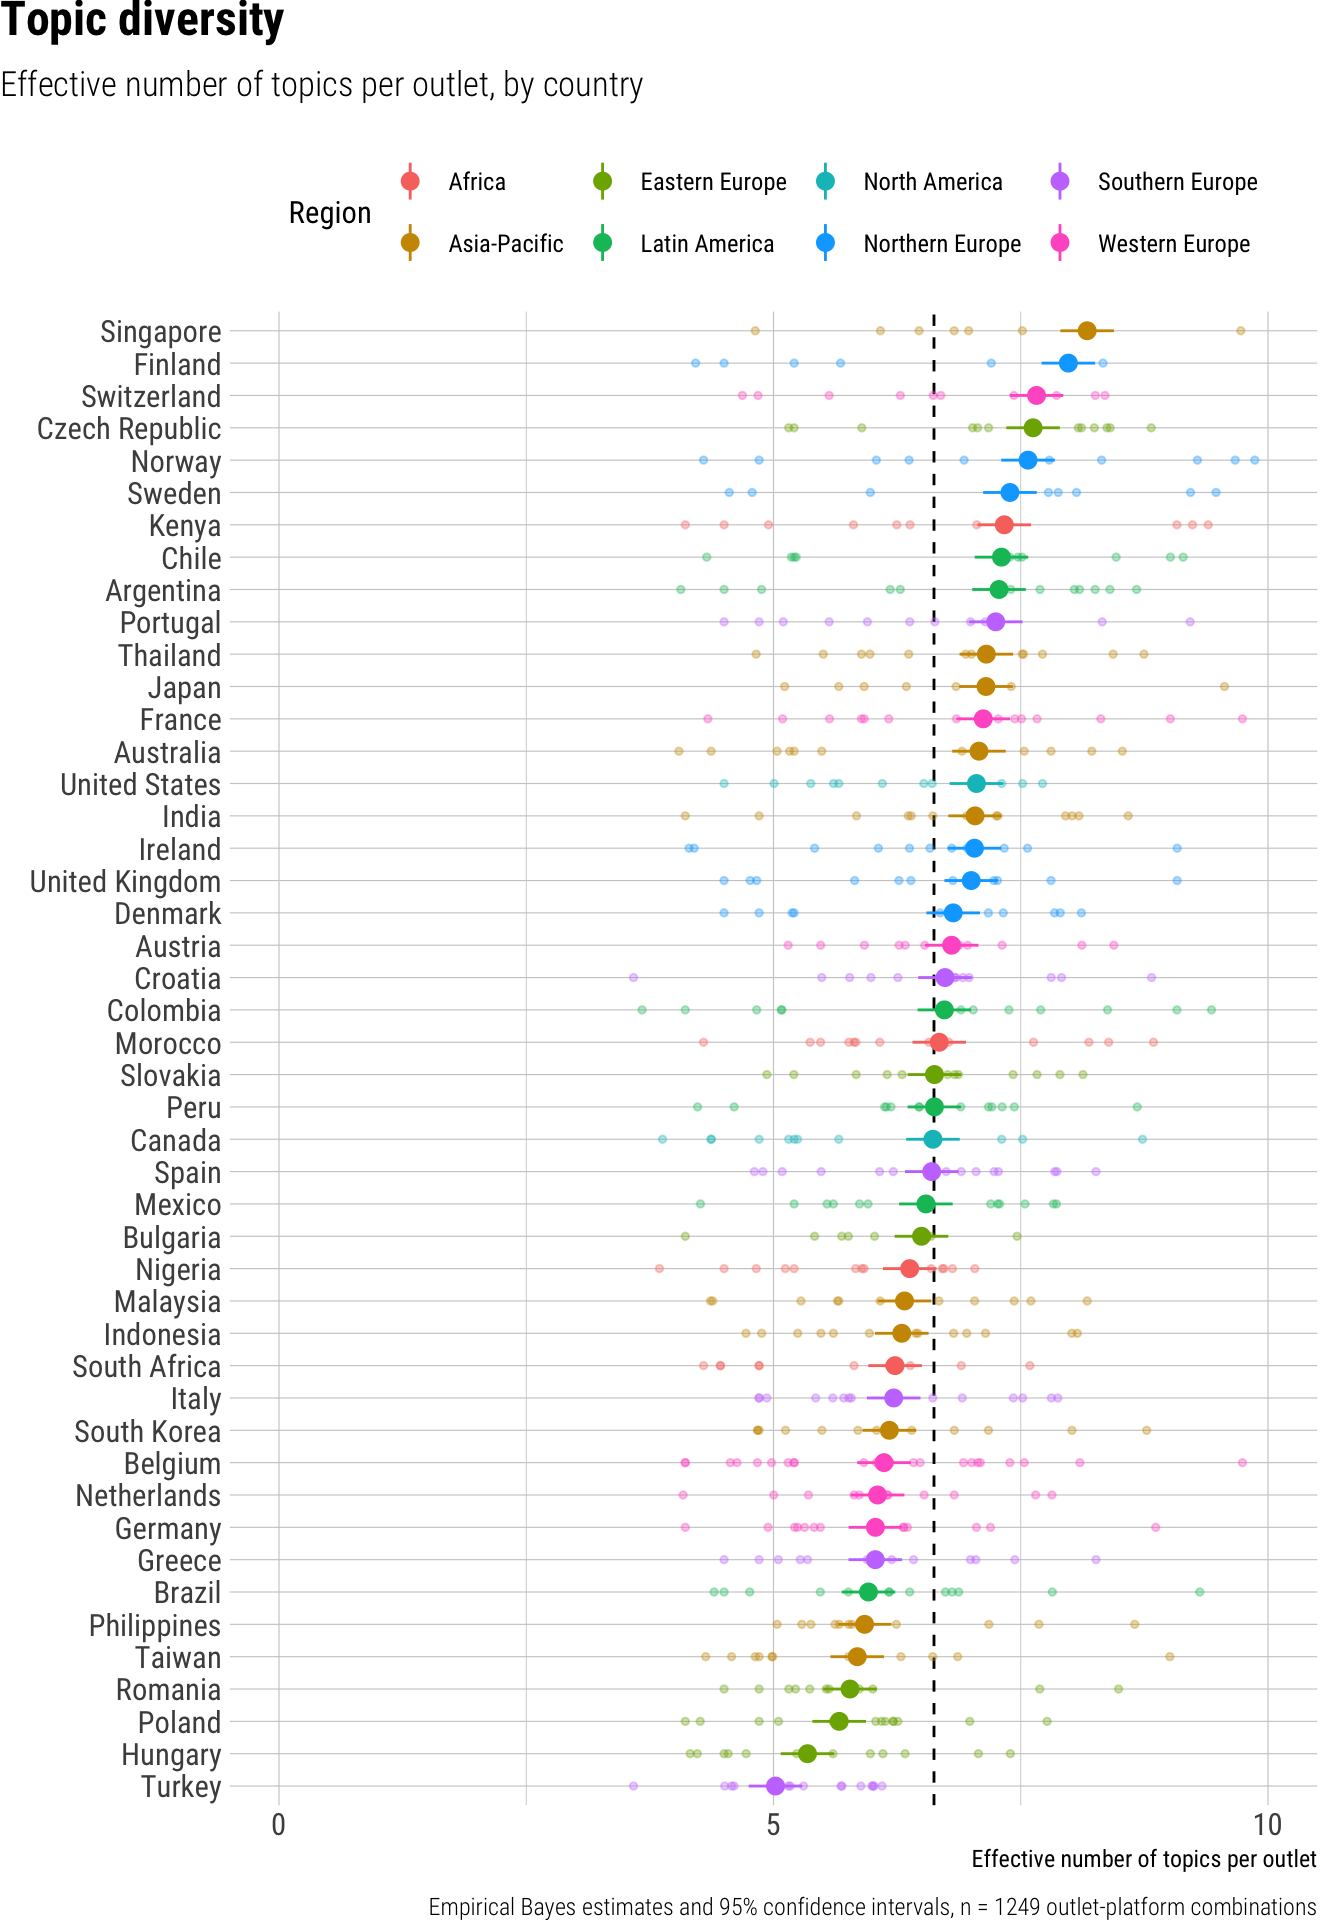
For topical diversity, we estimated the effective number of topics per outlet-platform combination, based on our automatic topic classification with 19 news categories.
Topic diversity
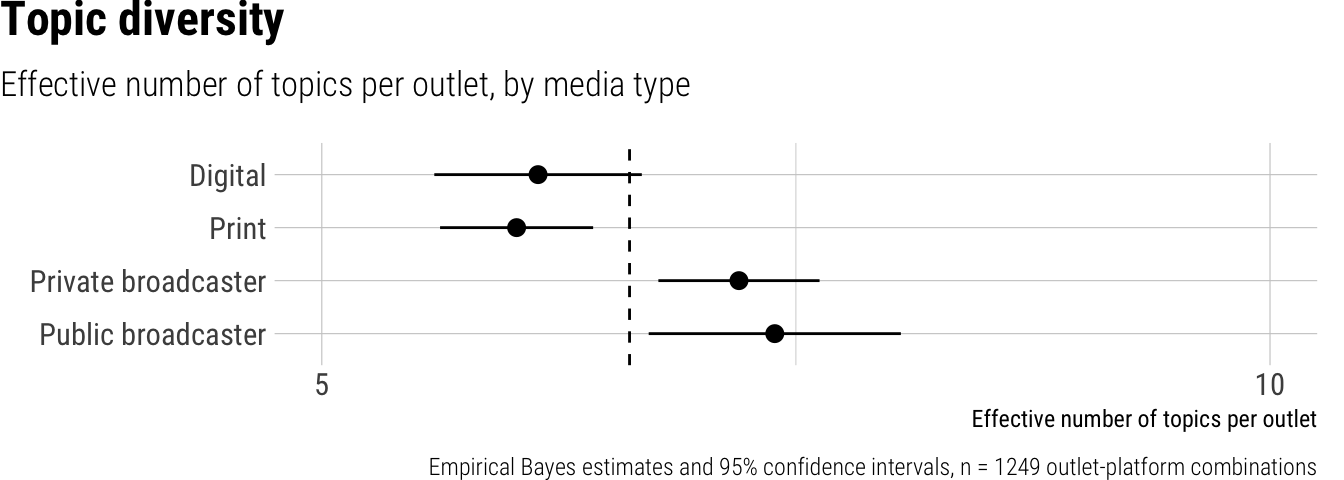
News outlets globally covered an average of 6.6 distinct topics in their short video posts. We observed notable differences in topic diversity across platforms and outlet types. Instagram posts (7.1) displayed slightly greater topic diversity compared to TikTok posts (6.9), while YouTube Shorts (5.5) consistently showed substantially lower diversity than both other platforms. Regarding outlet types, private broadcasters (7.2) exhibited significantly higher topic diversity than digital outlets (6.1). Public broadcasters also demonstrated high diversity (7.4), while print outlets (6.0) and digital outlets had comparable, lower diversity. Topic diversity also varied considerably by country, ranging from a low of 5.0 in Turkey to a high of 8.2 in Singapore.
Contrasts
| outlet_type |
Print - Digital |
-0.18 |
0.57 |
-0.82 |
0.45 |
| outlet_type |
Private broadcaster - Digital |
1.22 |
0.00 |
0.58 |
1.87 |
| outlet_type |
Public broadcaster - Digital |
0.63 |
0.14 |
-0.20 |
1.45 |
| platform |
Instagram - TikTok |
0.35 |
0.04 |
0.01 |
0.69 |
| platform |
YouTube Shorts - TikTok |
-1.54 |
0.00 |
-1.92 |
-1.17 |
Predictions by outlet type
| Digital |
6.14 |
0 |
5.59 |
6.69 |
| Print |
6.03 |
0 |
5.62 |
6.43 |
| Private broadcaster |
7.20 |
0 |
6.77 |
7.62 |
| Public broadcaster |
7.39 |
0 |
6.72 |
8.05 |
Predictions by country
| Argentina |
7.28 |
0 |
7.01 |
7.55 |
Latin America |
| Australia |
7.08 |
0 |
6.81 |
7.35 |
Asia-Pacific |
| Austria |
6.80 |
0 |
6.53 |
7.07 |
Western Europe |
| Belgium |
6.12 |
0 |
5.85 |
6.39 |
Western Europe |
| Brazil |
5.96 |
0 |
5.69 |
6.23 |
Latin America |
| Bulgaria |
6.50 |
0 |
6.23 |
6.77 |
Eastern Europe |
| Canada |
6.61 |
0 |
6.34 |
6.88 |
North America |
| Chile |
7.31 |
0 |
7.03 |
7.58 |
Latin America |
| Colombia |
6.73 |
0 |
6.46 |
7.00 |
Latin America |
| Croatia |
6.73 |
0 |
6.46 |
7.01 |
Southern Europe |
| Czech Republic |
7.62 |
0 |
7.35 |
7.90 |
Eastern Europe |
| Denmark |
6.82 |
0 |
6.55 |
7.09 |
Northern Europe |
| Finland |
7.98 |
0 |
7.71 |
8.25 |
Northern Europe |
| France |
7.12 |
0 |
6.85 |
7.39 |
Western Europe |
| Germany |
6.03 |
0 |
5.76 |
6.30 |
Western Europe |
| Greece |
6.03 |
0 |
5.76 |
6.30 |
Southern Europe |
| Hungary |
5.34 |
0 |
5.07 |
5.61 |
Eastern Europe |
| India |
7.04 |
0 |
6.77 |
7.31 |
Asia-Pacific |
| Indonesia |
6.30 |
0 |
6.03 |
6.57 |
Asia-Pacific |
| Ireland |
7.03 |
0 |
6.76 |
7.30 |
Northern Europe |
| Italy |
6.22 |
0 |
5.94 |
6.49 |
Southern Europe |
| Japan |
7.15 |
0 |
6.88 |
7.42 |
Asia-Pacific |
| Kenya |
7.33 |
0 |
7.06 |
7.60 |
Africa |
| Malaysia |
6.33 |
0 |
6.05 |
6.60 |
Asia-Pacific |
| Mexico |
6.54 |
0 |
6.27 |
6.81 |
Latin America |
| Morocco |
6.68 |
0 |
6.41 |
6.95 |
Africa |
| Netherlands |
6.05 |
0 |
5.78 |
6.32 |
Western Europe |
| Nigeria |
6.38 |
0 |
6.11 |
6.65 |
Africa |
| Norway |
7.57 |
0 |
7.30 |
7.84 |
Northern Europe |
| Peru |
6.63 |
0 |
6.36 |
6.90 |
Latin America |
| Philippines |
5.92 |
0 |
5.65 |
6.19 |
Asia-Pacific |
| Poland |
5.66 |
0 |
5.39 |
5.94 |
Eastern Europe |
| Portugal |
7.25 |
0 |
6.98 |
7.52 |
Southern Europe |
| Romania |
5.77 |
0 |
5.50 |
6.04 |
Eastern Europe |
| Singapore |
8.17 |
0 |
7.90 |
8.44 |
Asia-Pacific |
| Slovakia |
6.63 |
0 |
6.36 |
6.90 |
Eastern Europe |
| South Africa |
6.23 |
0 |
5.96 |
6.50 |
Africa |
| South Korea |
6.17 |
0 |
5.90 |
6.44 |
Asia-Pacific |
| Spain |
6.60 |
0 |
6.33 |
6.87 |
Southern Europe |
| Sweden |
7.39 |
0 |
7.12 |
7.66 |
Northern Europe |
| Switzerland |
7.66 |
0 |
7.39 |
7.93 |
Western Europe |
| Taiwan |
5.85 |
0 |
5.58 |
6.12 |
Asia-Pacific |
| Thailand |
7.15 |
0 |
6.88 |
7.42 |
Asia-Pacific |
| Turkey |
5.02 |
0 |
4.75 |
5.29 |
Southern Europe |
| United Kingdom |
7.00 |
0 |
6.73 |
7.27 |
Northern Europe |
| United States |
7.05 |
0 |
6.78 |
7.32 |
North America |
Measures
We measured demographic diversity using the FairFace classifier (Kärkkäinen and Joo 2019), which classifies apparent gender, age group and ethnicity.
Topic diversity was estimated by computing the effective number of topics, which accounts for number of topics coded per outlet and their frequency distribution, see Laakso and Taagepera (1979) for a similar measure.
_platform-1.png)
_type-1.png)
_country-1.png)
_platform-1.png)
_type-1.png)
_country-1.png)