Platformization
AI summaries
Note that all the summary texts on this page are currently generated automatically using a Large Language Model (Google’s Gemini), based on the results tables and other information from the data. Therefore, please do not cite the verbal summary, but refer to the figures and tables for accurate information.
Video, audio and text features
Video format
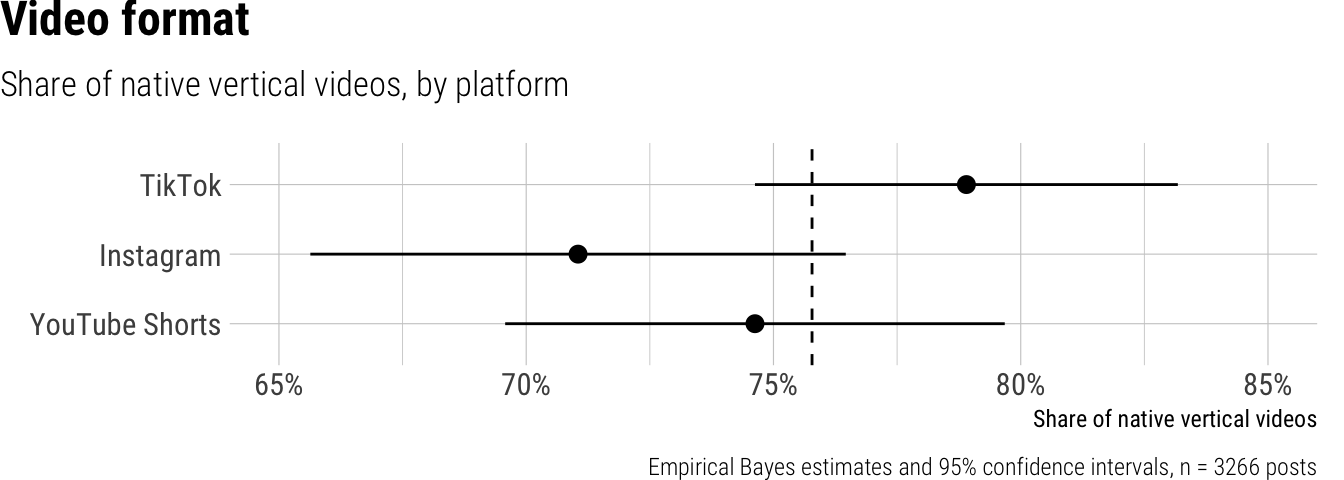
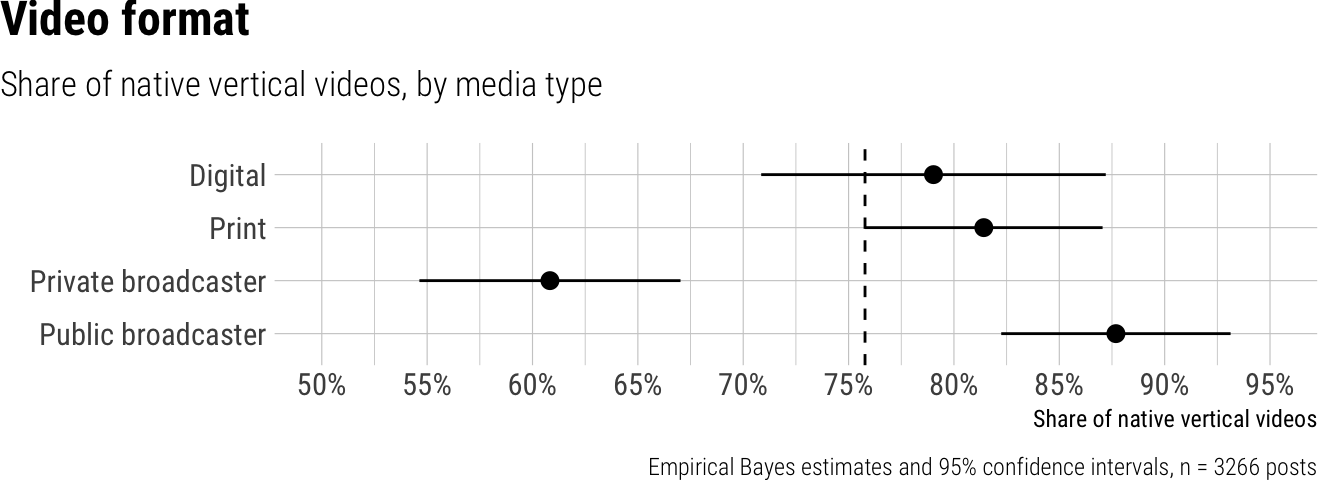
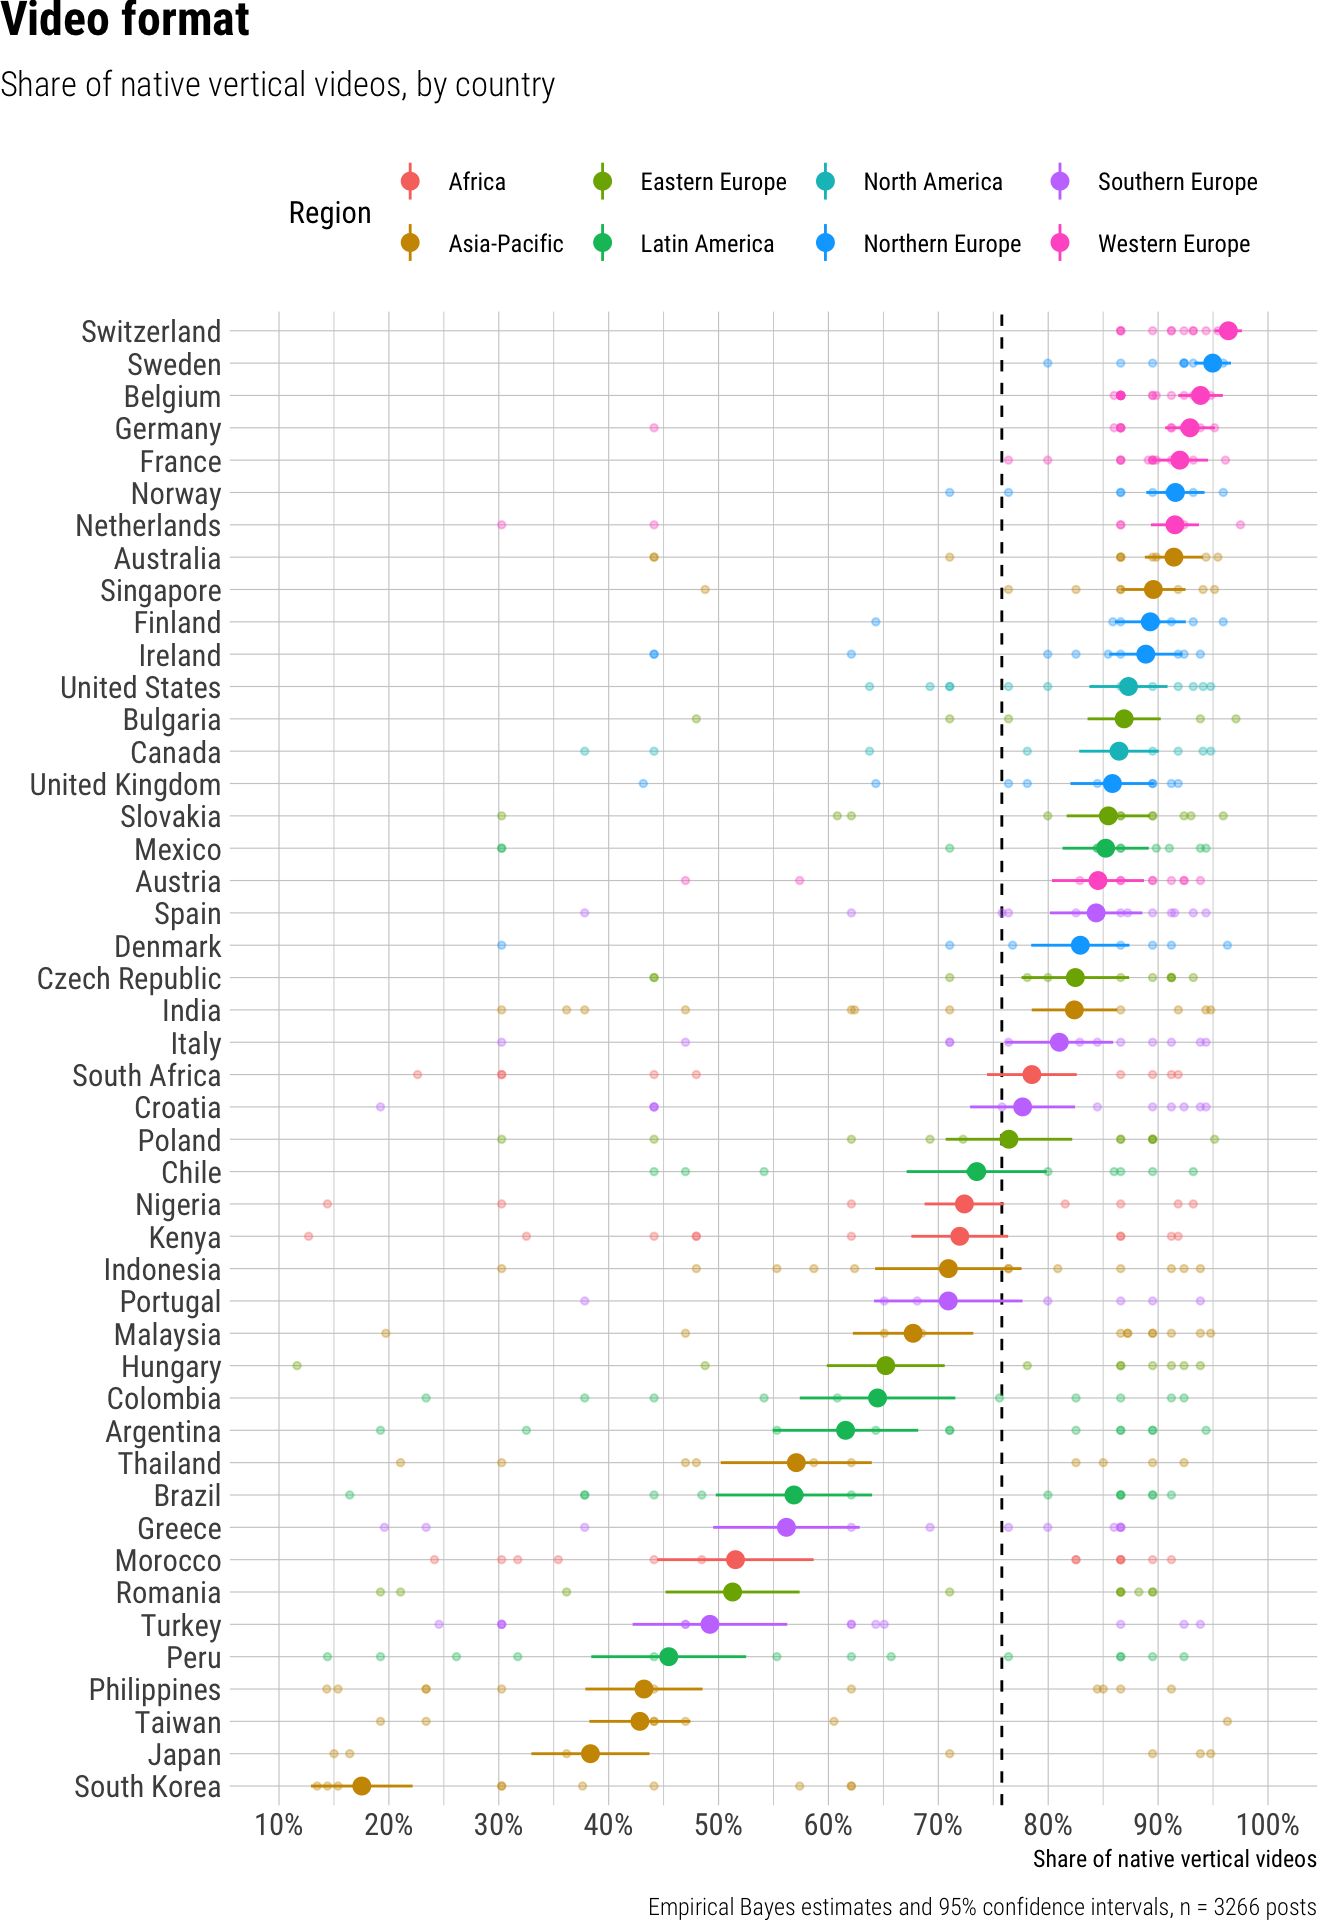
Across all news outlets and platforms studied, the overall average share of native vertical videos was 76%. We observed meaningful variations across platforms, with posts on TikTok showing the highest share of vertical native videos at 79%, followed by YouTube Shorts at 75%, and Instagram at 71%. Differences were also evident among outlet types: public broadcasters led with 88% of their content being native vertical videos, while private broadcasters posted the lowest share at 61%, significantly less than digital-native outlets (79%). Print outlets also showed a high adoption at 81%. Further, the adoption of native vertical video formats varied considerably by country, ranging from a low of 18% in South Korea and 38% in Japan, to a high of 96% in Switzerland and 95% in Sweden.
Result tables for Video format
Overall average
| estimate | p.value | conf.low | conf.high |
|---|---|---|---|
| 0.76 | 0 | 0.71 | 0.8 |
Contrasts
| term | contrast | estimate | p.value | conf.low | conf.high |
|---|---|---|---|---|---|
| outlet_type | Print - Digital | -0.02 | 0.64 | -0.08 | 0.05 |
| outlet_type | Private broadcaster - Digital | -0.17 | 0.00 | -0.24 | -0.09 |
| outlet_type | Public broadcaster - Digital | -0.04 | 0.39 | -0.12 | 0.05 |
| platform | Instagram - TikTok | -0.05 | 0.00 | -0.09 | -0.02 |
| platform | YouTube Shorts - TikTok | 0.01 | 0.41 | -0.02 | 0.05 |
Predictions by platform
| platform | estimate | p.value | conf.low | conf.high |
|---|---|---|---|---|
| TikTok | 0.79 | 0 | 0.75 | 0.83 |
| 0.71 | 0 | 0.66 | 0.76 | |
| YouTube Shorts | 0.75 | 0 | 0.70 | 0.80 |
Predictions by outlet type
| outlet_type | estimate | p.value | conf.low | conf.high |
|---|---|---|---|---|
| Digital | 0.79 | 0 | 0.71 | 0.87 |
| 0.81 | 0 | 0.76 | 0.87 | |
| Private broadcaster | 0.61 | 0 | 0.55 | 0.67 |
| Public broadcaster | 0.88 | 0 | 0.82 | 0.93 |
Predictions by country
| country | estimate | p.value | conf.low | conf.high | region |
|---|---|---|---|---|---|
| Argentina | 0.62 | 0 | 0.55 | 0.68 | Latin America |
| Australia | 0.91 | 0 | 0.89 | 0.94 | Asia-Pacific |
| Austria | 0.85 | 0 | 0.80 | 0.89 | Western Europe |
| Belgium | 0.94 | 0 | 0.92 | 0.96 | Western Europe |
| Brazil | 0.57 | 0 | 0.50 | 0.64 | Latin America |
| Bulgaria | 0.87 | 0 | 0.84 | 0.90 | Eastern Europe |
| Canada | 0.86 | 0 | 0.83 | 0.90 | North America |
| Chile | 0.73 | 0 | 0.67 | 0.80 | Latin America |
| Colombia | 0.64 | 0 | 0.57 | 0.72 | Latin America |
| Croatia | 0.78 | 0 | 0.73 | 0.82 | Southern Europe |
| Czech Republic | 0.82 | 0 | 0.78 | 0.87 | Eastern Europe |
| Denmark | 0.83 | 0 | 0.78 | 0.87 | Northern Europe |
| Finland | 0.89 | 0 | 0.86 | 0.93 | Northern Europe |
| France | 0.92 | 0 | 0.89 | 0.95 | Western Europe |
| Germany | 0.93 | 0 | 0.91 | 0.95 | Western Europe |
| Greece | 0.56 | 0 | 0.50 | 0.63 | Southern Europe |
| Hungary | 0.65 | 0 | 0.60 | 0.71 | Eastern Europe |
| India | 0.82 | 0 | 0.78 | 0.86 | Asia-Pacific |
| Indonesia | 0.71 | 0 | 0.64 | 0.78 | Asia-Pacific |
| Ireland | 0.89 | 0 | 0.86 | 0.92 | Northern Europe |
| Italy | 0.81 | 0 | 0.76 | 0.86 | Southern Europe |
| Japan | 0.38 | 0 | 0.33 | 0.44 | Asia-Pacific |
| Kenya | 0.72 | 0 | 0.68 | 0.76 | Africa |
| Malaysia | 0.68 | 0 | 0.62 | 0.73 | Asia-Pacific |
| Mexico | 0.85 | 0 | 0.81 | 0.89 | Latin America |
| Morocco | 0.52 | 0 | 0.44 | 0.59 | Africa |
| Netherlands | 0.92 | 0 | 0.89 | 0.94 | Western Europe |
| Nigeria | 0.72 | 0 | 0.69 | 0.76 | Africa |
| Norway | 0.92 | 0 | 0.89 | 0.94 | Northern Europe |
| Peru | 0.45 | 0 | 0.38 | 0.53 | Latin America |
| Philippines | 0.43 | 0 | 0.38 | 0.49 | Asia-Pacific |
| Poland | 0.76 | 0 | 0.71 | 0.82 | Eastern Europe |
| Portugal | 0.71 | 0 | 0.64 | 0.78 | Southern Europe |
| Romania | 0.51 | 0 | 0.45 | 0.57 | Eastern Europe |
| Singapore | 0.90 | 0 | 0.87 | 0.92 | Asia-Pacific |
| Slovakia | 0.85 | 0 | 0.82 | 0.89 | Eastern Europe |
| South Africa | 0.79 | 0 | 0.74 | 0.83 | Africa |
| South Korea | 0.18 | 0 | 0.13 | 0.22 | Asia-Pacific |
| Spain | 0.84 | 0 | 0.80 | 0.89 | Southern Europe |
| Sweden | 0.95 | 0 | 0.93 | 0.97 | Northern Europe |
| Switzerland | 0.96 | 0 | 0.95 | 0.98 | Western Europe |
| Taiwan | 0.43 | 0 | 0.38 | 0.47 | Asia-Pacific |
| Thailand | 0.57 | 0 | 0.50 | 0.64 | Asia-Pacific |
| Turkey | 0.49 | 0 | 0.42 | 0.56 | Southern Europe |
| United Kingdom | 0.86 | 0 | 0.82 | 0.90 | Northern Europe |
| United States | 0.87 | 0 | 0.84 | 0.91 | North America |
Music use
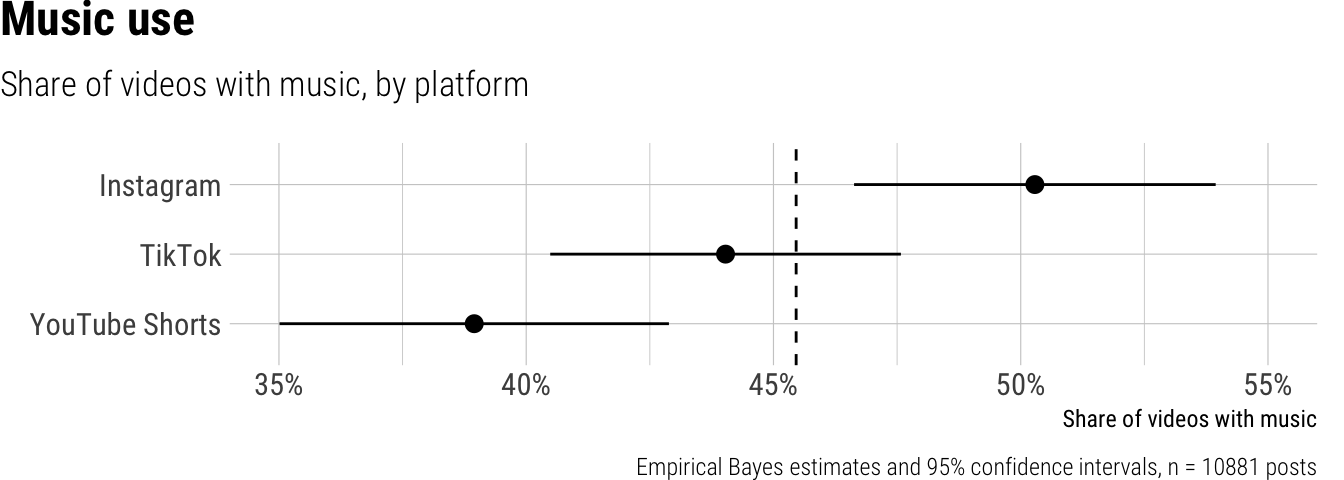
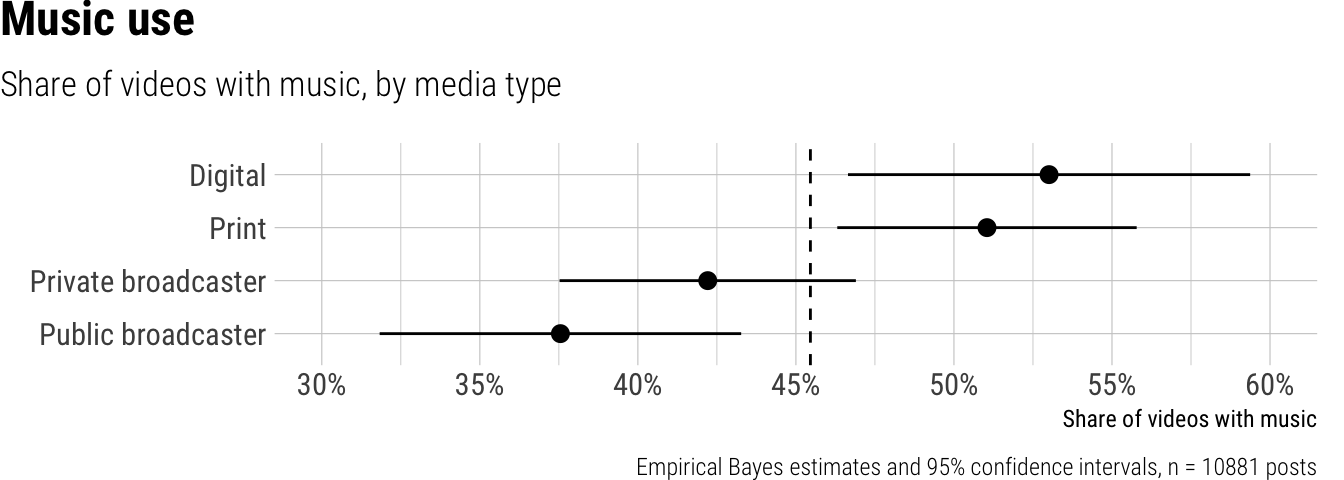
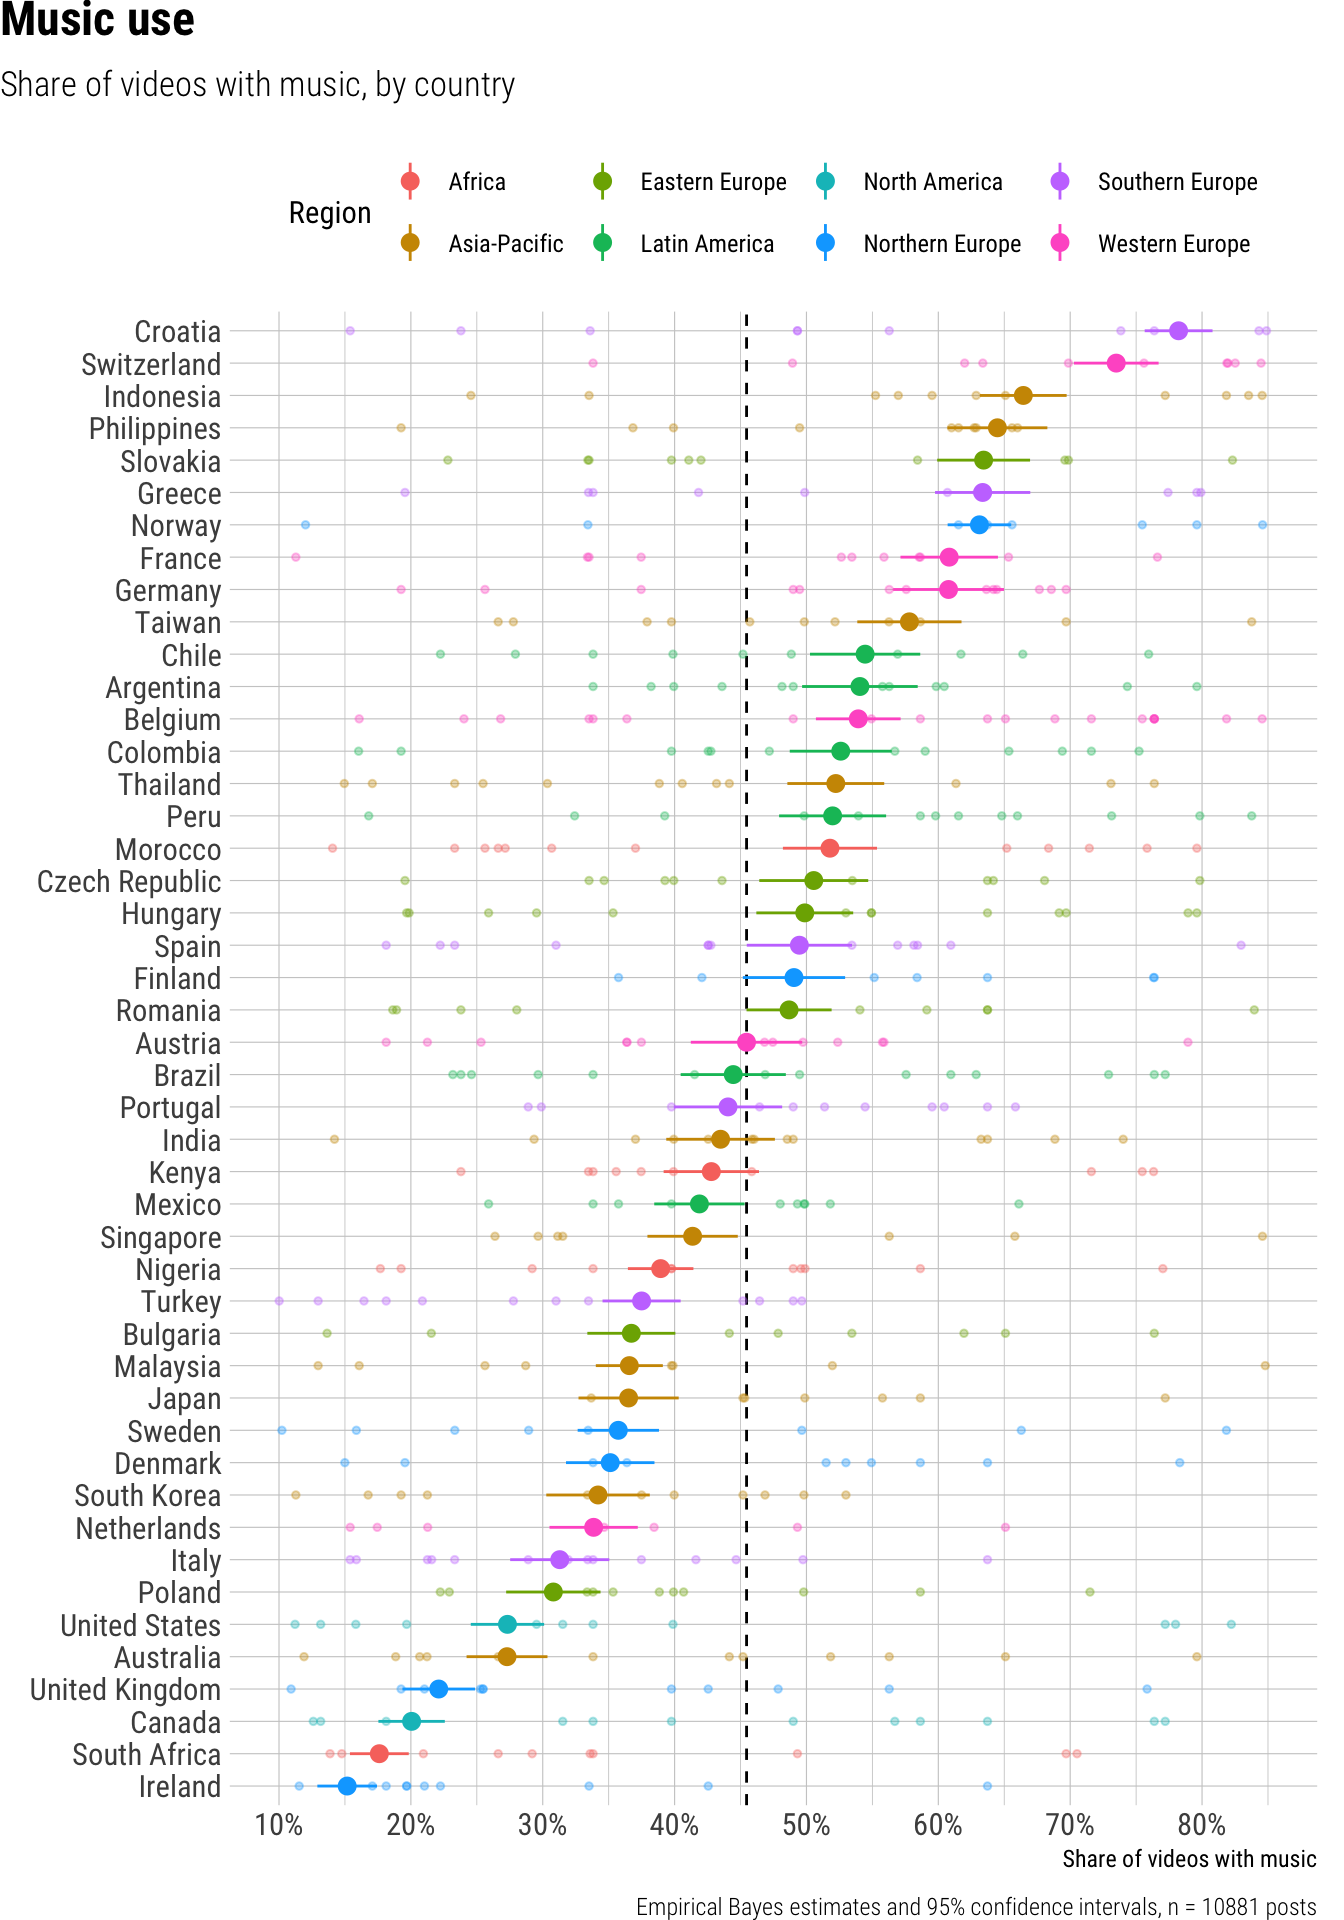
Across all short video posts by news outlets, we observed that an average of 45% included music. Music use varied significantly across platforms: Instagram videos included music in 50% of posts, which was significantly higher than TikTok at 44% and YouTube Shorts at 39%. We also noted that outlet type played a role; digital native outlets and print outlets showed the highest music use at 53% and 51% respectively. Private broadcasters used music in 42% of their videos, a significantly lower proportion than digital outlets, while public broadcasters had the lowest music use at 38%. Music use also varied substantially by country, ranging from a low of 15% in Ireland and 18% in South Africa, to a high of 78% in Croatia and 73% in Switzerland.
Result tables for Music use
Overall average
| estimate | p.value | conf.low | conf.high |
|---|---|---|---|
| 0.45 | 0 | 0.42 | 0.49 |
Contrasts
| term | contrast | estimate | p.value | conf.low | conf.high |
|---|---|---|---|---|---|
| outlet_type | Print - Digital | 0.00 | 0.92 | -0.06 | 0.07 |
| outlet_type | Private broadcaster - Digital | -0.08 | 0.03 | -0.14 | -0.01 |
| outlet_type | Public broadcaster - Digital | -0.03 | 0.45 | -0.12 | 0.05 |
| platform | TikTok - Instagram | -0.03 | 0.01 | -0.05 | -0.01 |
| platform | YouTube Shorts - Instagram | -0.06 | 0.00 | -0.09 | -0.04 |
Predictions by platform
| platform | estimate | p.value | conf.low | conf.high |
|---|---|---|---|---|
| 0.50 | 0 | 0.47 | 0.54 | |
| TikTok | 0.44 | 0 | 0.40 | 0.48 |
| YouTube Shorts | 0.39 | 0 | 0.35 | 0.43 |
Predictions by outlet type
| outlet_type | estimate | p.value | conf.low | conf.high |
|---|---|---|---|---|
| Digital | 0.53 | 0 | 0.47 | 0.59 |
| 0.51 | 0 | 0.46 | 0.56 | |
| Private broadcaster | 0.42 | 0 | 0.38 | 0.47 |
| Public broadcaster | 0.38 | 0 | 0.32 | 0.43 |
Predictions by country
| country | estimate | p.value | conf.low | conf.high | region |
|---|---|---|---|---|---|
| Argentina | 0.54 | 0 | 0.50 | 0.58 | Latin America |
| Australia | 0.27 | 0 | 0.24 | 0.30 | Asia-Pacific |
| Austria | 0.45 | 0 | 0.41 | 0.50 | Western Europe |
| Belgium | 0.54 | 0 | 0.51 | 0.57 | Western Europe |
| Brazil | 0.44 | 0 | 0.40 | 0.48 | Latin America |
| Bulgaria | 0.37 | 0 | 0.33 | 0.40 | Eastern Europe |
| Canada | 0.20 | 0 | 0.18 | 0.23 | North America |
| Chile | 0.54 | 0 | 0.50 | 0.59 | Latin America |
| Colombia | 0.53 | 0 | 0.49 | 0.56 | Latin America |
| Croatia | 0.78 | 0 | 0.76 | 0.81 | Southern Europe |
| Czech Republic | 0.51 | 0 | 0.46 | 0.55 | Eastern Europe |
| Denmark | 0.35 | 0 | 0.32 | 0.38 | Northern Europe |
| Finland | 0.49 | 0 | 0.45 | 0.53 | Northern Europe |
| France | 0.61 | 0 | 0.57 | 0.65 | Western Europe |
| Germany | 0.61 | 0 | 0.57 | 0.65 | Western Europe |
| Greece | 0.63 | 0 | 0.60 | 0.67 | Southern Europe |
| Hungary | 0.50 | 0 | 0.46 | 0.54 | Eastern Europe |
| India | 0.43 | 0 | 0.39 | 0.48 | Asia-Pacific |
| Indonesia | 0.66 | 0 | 0.63 | 0.70 | Asia-Pacific |
| Ireland | 0.15 | 0 | 0.13 | 0.17 | Northern Europe |
| Italy | 0.31 | 0 | 0.28 | 0.35 | Southern Europe |
| Japan | 0.37 | 0 | 0.33 | 0.40 | Asia-Pacific |
| Kenya | 0.43 | 0 | 0.39 | 0.46 | Africa |
| Malaysia | 0.37 | 0 | 0.34 | 0.39 | Asia-Pacific |
| Mexico | 0.42 | 0 | 0.38 | 0.45 | Latin America |
| Morocco | 0.52 | 0 | 0.48 | 0.55 | Africa |
| Netherlands | 0.34 | 0 | 0.31 | 0.37 | Western Europe |
| Nigeria | 0.39 | 0 | 0.36 | 0.41 | Africa |
| Norway | 0.63 | 0 | 0.61 | 0.66 | Northern Europe |
| Peru | 0.52 | 0 | 0.48 | 0.56 | Latin America |
| Philippines | 0.64 | 0 | 0.61 | 0.68 | Asia-Pacific |
| Poland | 0.31 | 0 | 0.27 | 0.34 | Eastern Europe |
| Portugal | 0.44 | 0 | 0.40 | 0.48 | Southern Europe |
| Romania | 0.49 | 0 | 0.45 | 0.52 | Eastern Europe |
| Singapore | 0.41 | 0 | 0.38 | 0.45 | Asia-Pacific |
| Slovakia | 0.63 | 0 | 0.60 | 0.67 | Eastern Europe |
| South Africa | 0.18 | 0 | 0.15 | 0.20 | Africa |
| South Korea | 0.34 | 0 | 0.30 | 0.38 | Asia-Pacific |
| Spain | 0.49 | 0 | 0.45 | 0.53 | Southern Europe |
| Sweden | 0.36 | 0 | 0.33 | 0.39 | Northern Europe |
| Switzerland | 0.73 | 0 | 0.70 | 0.77 | Western Europe |
| Taiwan | 0.58 | 0 | 0.54 | 0.62 | Asia-Pacific |
| Thailand | 0.52 | 0 | 0.49 | 0.56 | Asia-Pacific |
| Turkey | 0.37 | 0 | 0.35 | 0.40 | Southern Europe |
| United Kingdom | 0.22 | 0 | 0.19 | 0.25 | Northern Europe |
| United States | 0.27 | 0 | 0.25 | 0.30 | North America |
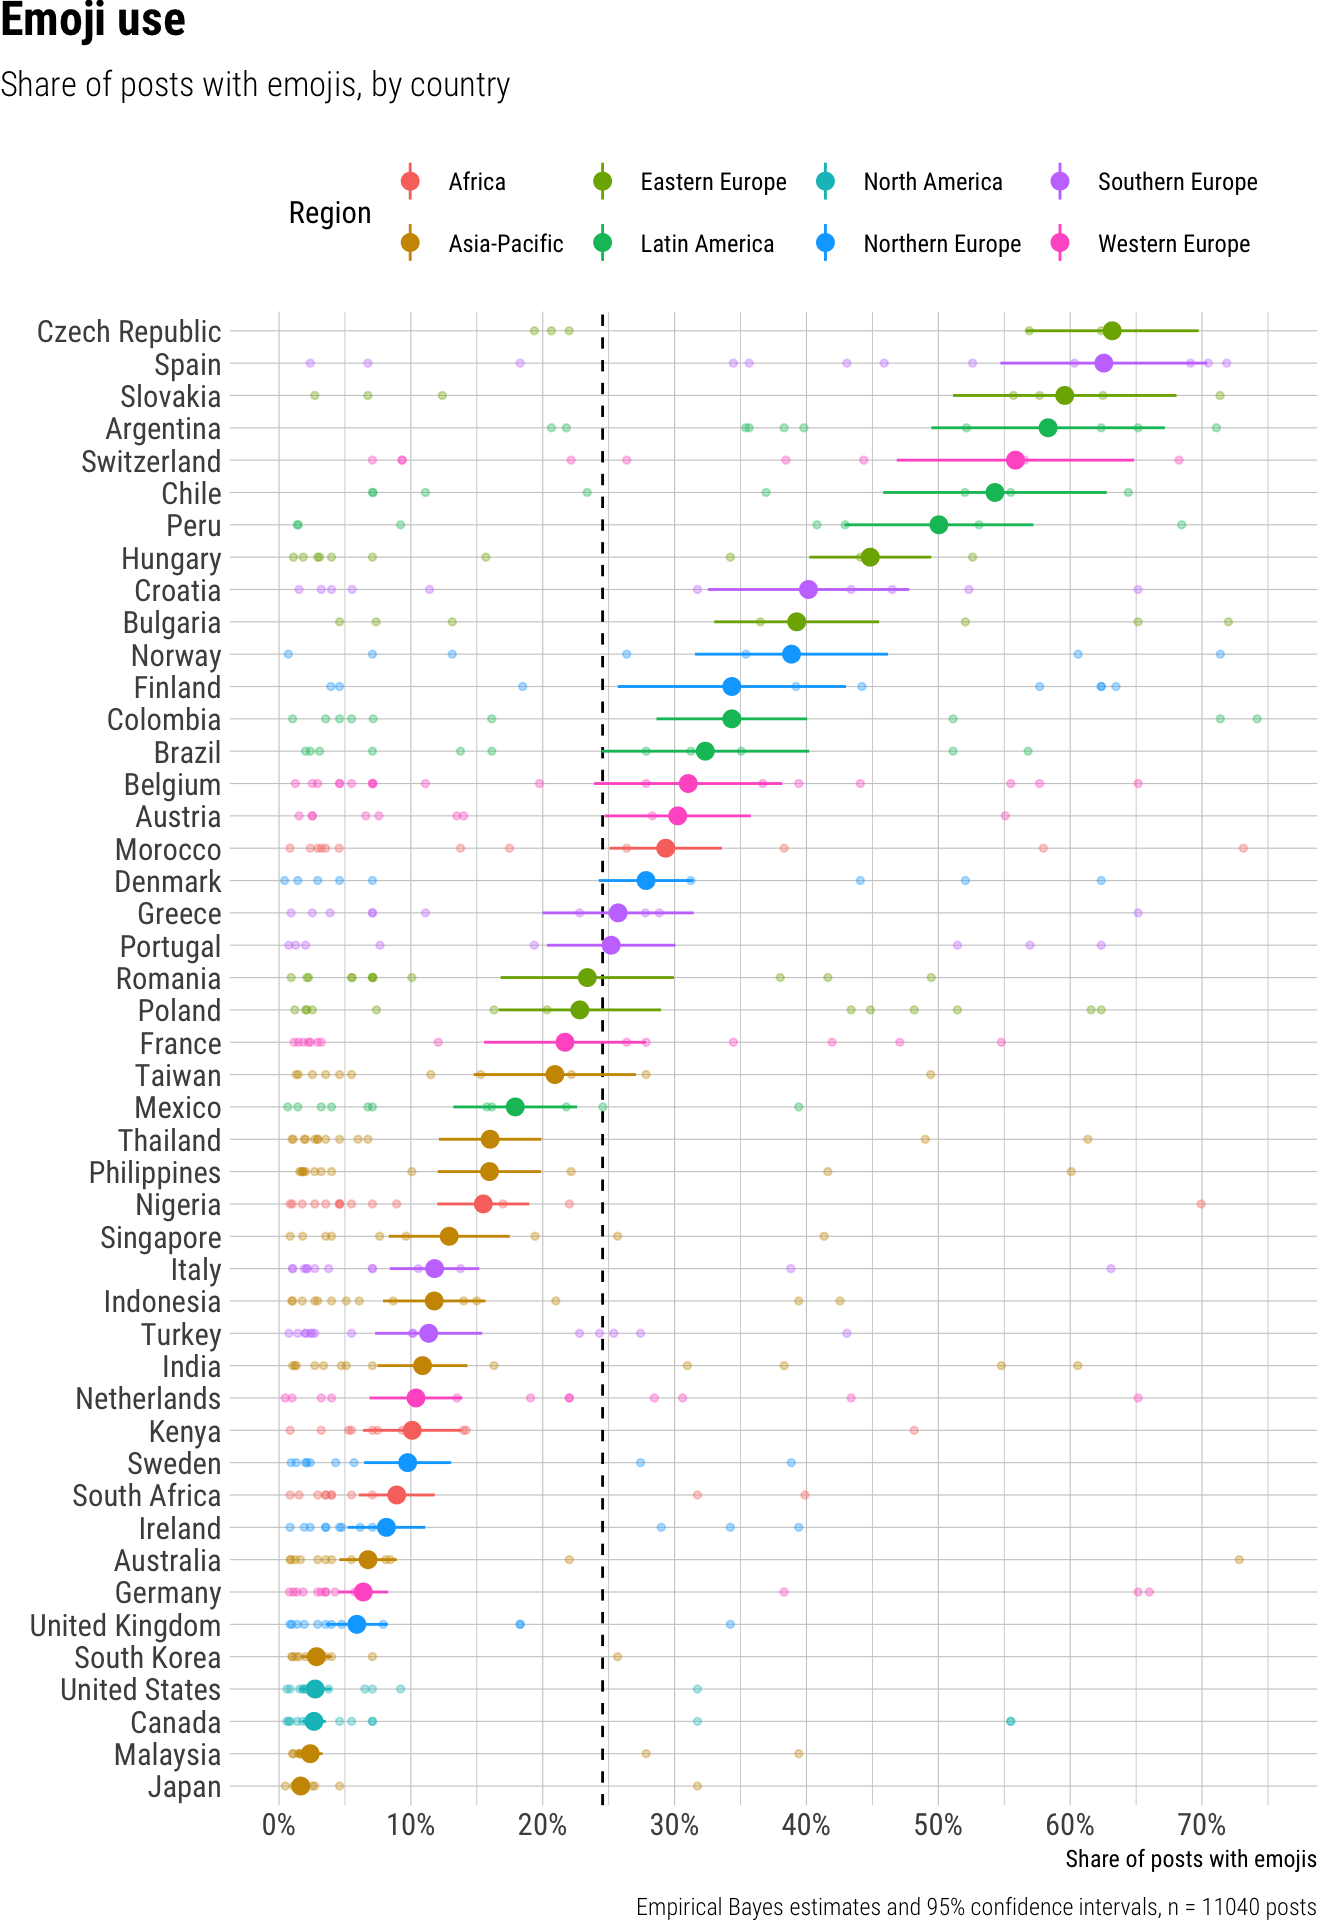
Emoji use
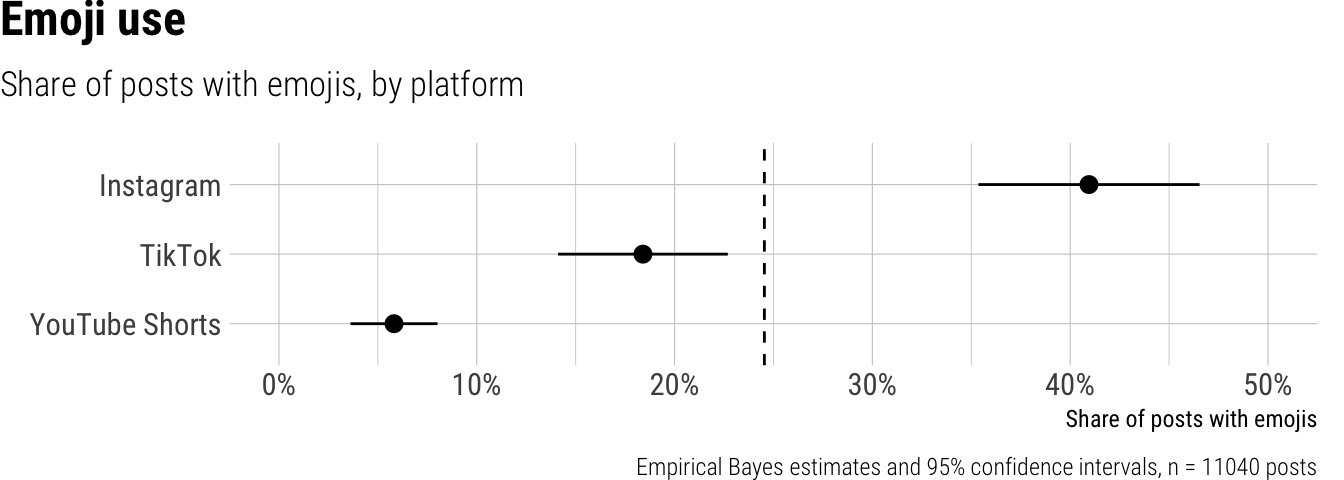
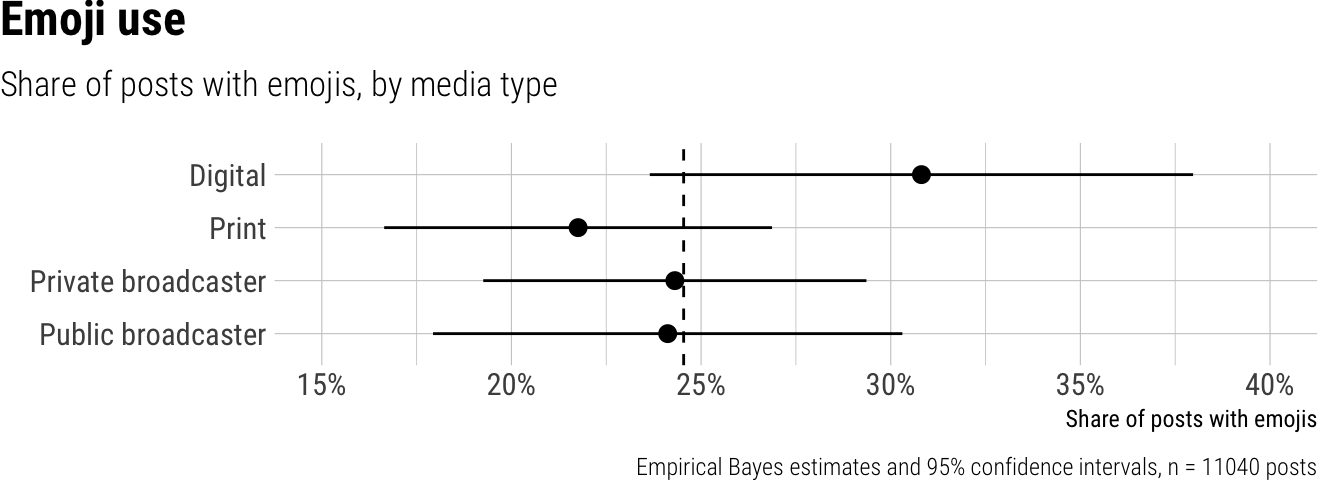
Across all platforms, 25% of short video news posts included emojis. Emoji use varied substantially and significantly by platform: Instagram posts incorporated emojis the most at 41%, followed by TikTok at 18%, and YouTube Shorts significantly less at only 6%. Differences in emoji use by outlet type were small and not statistically significant; digital news outlets included emojis in 31% of posts, while print, private broadcasters, and public broadcasters showed comparable rates of 22-24%. We also observed a wide range of emoji adoption across countries, from a low of 2% in Japan and 3% in Canada and the United States, to a high of 63% in the Czech Republic and Spain.
Result tables for Emoji use
Overall average
| estimate | p.value | conf.low | conf.high |
|---|---|---|---|
| 0.25 | 0 | 0.2 | 0.29 |
Contrasts
| term | contrast | estimate | p.value | conf.low | conf.high |
|---|---|---|---|---|---|
| outlet_type | Print - Digital | -0.05 | 0.09 | -0.11 | 0.01 |
| outlet_type | Private broadcaster - Digital | -0.01 | 0.86 | -0.07 | 0.06 |
| outlet_type | Public broadcaster - Digital | 0.06 | 0.14 | -0.02 | 0.14 |
| platform | TikTok - Instagram | -0.18 | 0.00 | -0.20 | -0.16 |
| platform | YouTube Shorts - Instagram | -0.29 | 0.00 | -0.32 | -0.26 |
Predictions by platform
| platform | estimate | p.value | conf.low | conf.high |
|---|---|---|---|---|
| 0.41 | 0 | 0.35 | 0.47 | |
| TikTok | 0.18 | 0 | 0.14 | 0.23 |
| YouTube Shorts | 0.06 | 0 | 0.04 | 0.08 |
Predictions by outlet type
| outlet_type | estimate | p.value | conf.low | conf.high |
|---|---|---|---|---|
| Digital | 0.31 | 0 | 0.24 | 0.38 |
| 0.22 | 0 | 0.17 | 0.27 | |
| Private broadcaster | 0.24 | 0 | 0.19 | 0.29 |
| Public broadcaster | 0.24 | 0 | 0.18 | 0.30 |
Predictions by country
| country | estimate | p.value | conf.low | conf.high | region |
|---|---|---|---|---|---|
| Argentina | 0.58 | 0 | 0.49 | 0.67 | Latin America |
| Australia | 0.07 | 0 | 0.05 | 0.09 | Asia-Pacific |
| Austria | 0.30 | 0 | 0.25 | 0.36 | Western Europe |
| Belgium | 0.31 | 0 | 0.24 | 0.38 | Western Europe |
| Brazil | 0.32 | 0 | 0.24 | 0.40 | Latin America |
| Bulgaria | 0.39 | 0 | 0.33 | 0.46 | Eastern Europe |
| Canada | 0.03 | 0 | 0.02 | 0.04 | North America |
| Chile | 0.54 | 0 | 0.46 | 0.63 | Latin America |
| Colombia | 0.34 | 0 | 0.29 | 0.40 | Latin America |
| Croatia | 0.40 | 0 | 0.33 | 0.48 | Southern Europe |
| Czech Republic | 0.63 | 0 | 0.57 | 0.70 | Eastern Europe |
| Denmark | 0.28 | 0 | 0.24 | 0.31 | Northern Europe |
| Finland | 0.34 | 0 | 0.26 | 0.43 | Northern Europe |
| France | 0.22 | 0 | 0.16 | 0.28 | Western Europe |
| Germany | 0.06 | 0 | 0.04 | 0.08 | Western Europe |
| Greece | 0.26 | 0 | 0.20 | 0.31 | Southern Europe |
| Hungary | 0.45 | 0 | 0.40 | 0.49 | Eastern Europe |
| India | 0.11 | 0 | 0.07 | 0.14 | Asia-Pacific |
| Indonesia | 0.12 | 0 | 0.08 | 0.16 | Asia-Pacific |
| Ireland | 0.08 | 0 | 0.05 | 0.11 | Northern Europe |
| Italy | 0.12 | 0 | 0.08 | 0.15 | Southern Europe |
| Japan | 0.02 | 0 | 0.01 | 0.02 | Asia-Pacific |
| Kenya | 0.10 | 0 | 0.06 | 0.14 | Africa |
| Malaysia | 0.02 | 0 | 0.01 | 0.03 | Asia-Pacific |
| Mexico | 0.18 | 0 | 0.13 | 0.23 | Latin America |
| Morocco | 0.29 | 0 | 0.25 | 0.34 | Africa |
| Netherlands | 0.10 | 0 | 0.07 | 0.14 | Western Europe |
| Nigeria | 0.15 | 0 | 0.12 | 0.19 | Africa |
| Norway | 0.39 | 0 | 0.32 | 0.46 | Northern Europe |
| Peru | 0.50 | 0 | 0.43 | 0.57 | Latin America |
| Philippines | 0.16 | 0 | 0.12 | 0.20 | Asia-Pacific |
| Poland | 0.23 | 0 | 0.17 | 0.29 | Eastern Europe |
| Portugal | 0.25 | 0 | 0.20 | 0.30 | Southern Europe |
| Romania | 0.23 | 0 | 0.17 | 0.30 | Eastern Europe |
| Singapore | 0.13 | 0 | 0.08 | 0.17 | Asia-Pacific |
| Slovakia | 0.60 | 0 | 0.51 | 0.68 | Eastern Europe |
| South Africa | 0.09 | 0 | 0.06 | 0.12 | Africa |
| South Korea | 0.03 | 0 | 0.02 | 0.04 | Asia-Pacific |
| Spain | 0.63 | 0 | 0.55 | 0.70 | Southern Europe |
| Sweden | 0.10 | 0 | 0.06 | 0.13 | Northern Europe |
| Switzerland | 0.56 | 0 | 0.47 | 0.65 | Western Europe |
| Taiwan | 0.21 | 0 | 0.15 | 0.27 | Asia-Pacific |
| Thailand | 0.16 | 0 | 0.12 | 0.20 | Asia-Pacific |
| Turkey | 0.11 | 0 | 0.07 | 0.15 | Southern Europe |
| United Kingdom | 0.06 | 0 | 0.04 | 0.08 | Northern Europe |
| United States | 0.03 | 0 | 0.02 | 0.04 | North America |
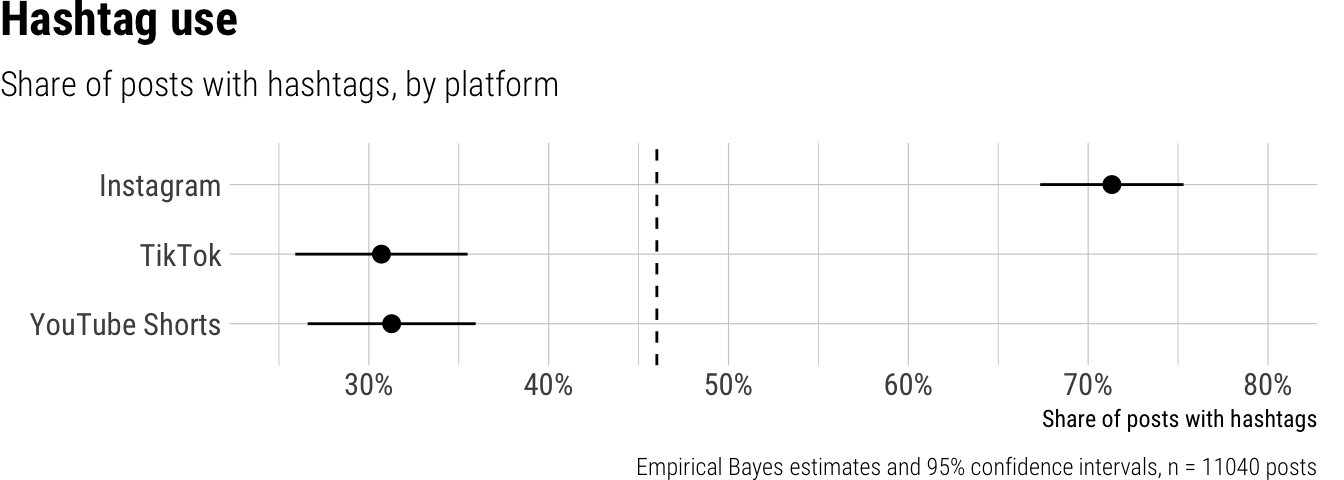
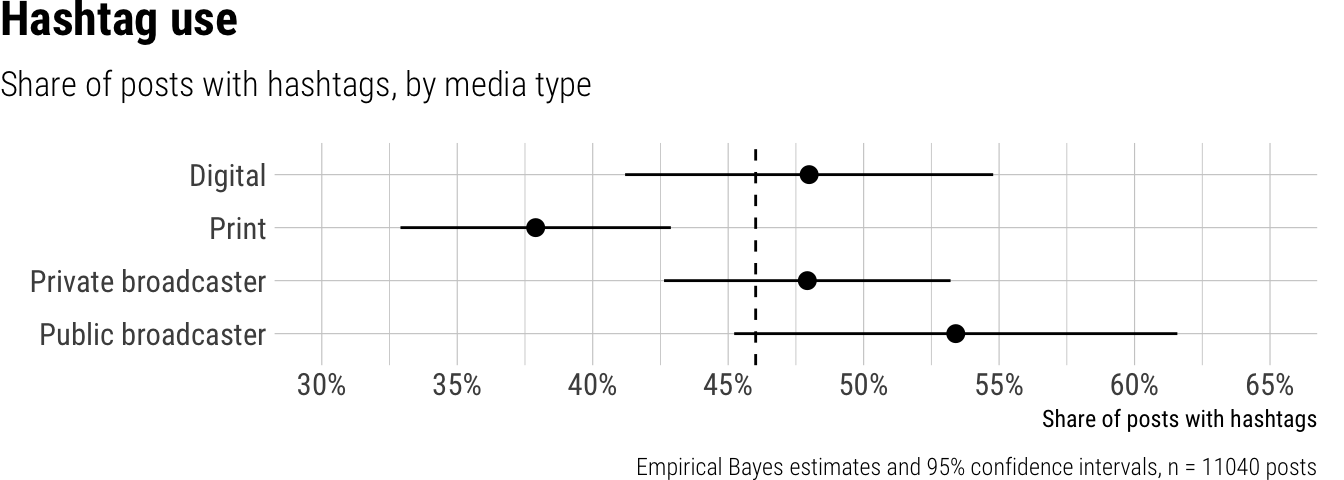
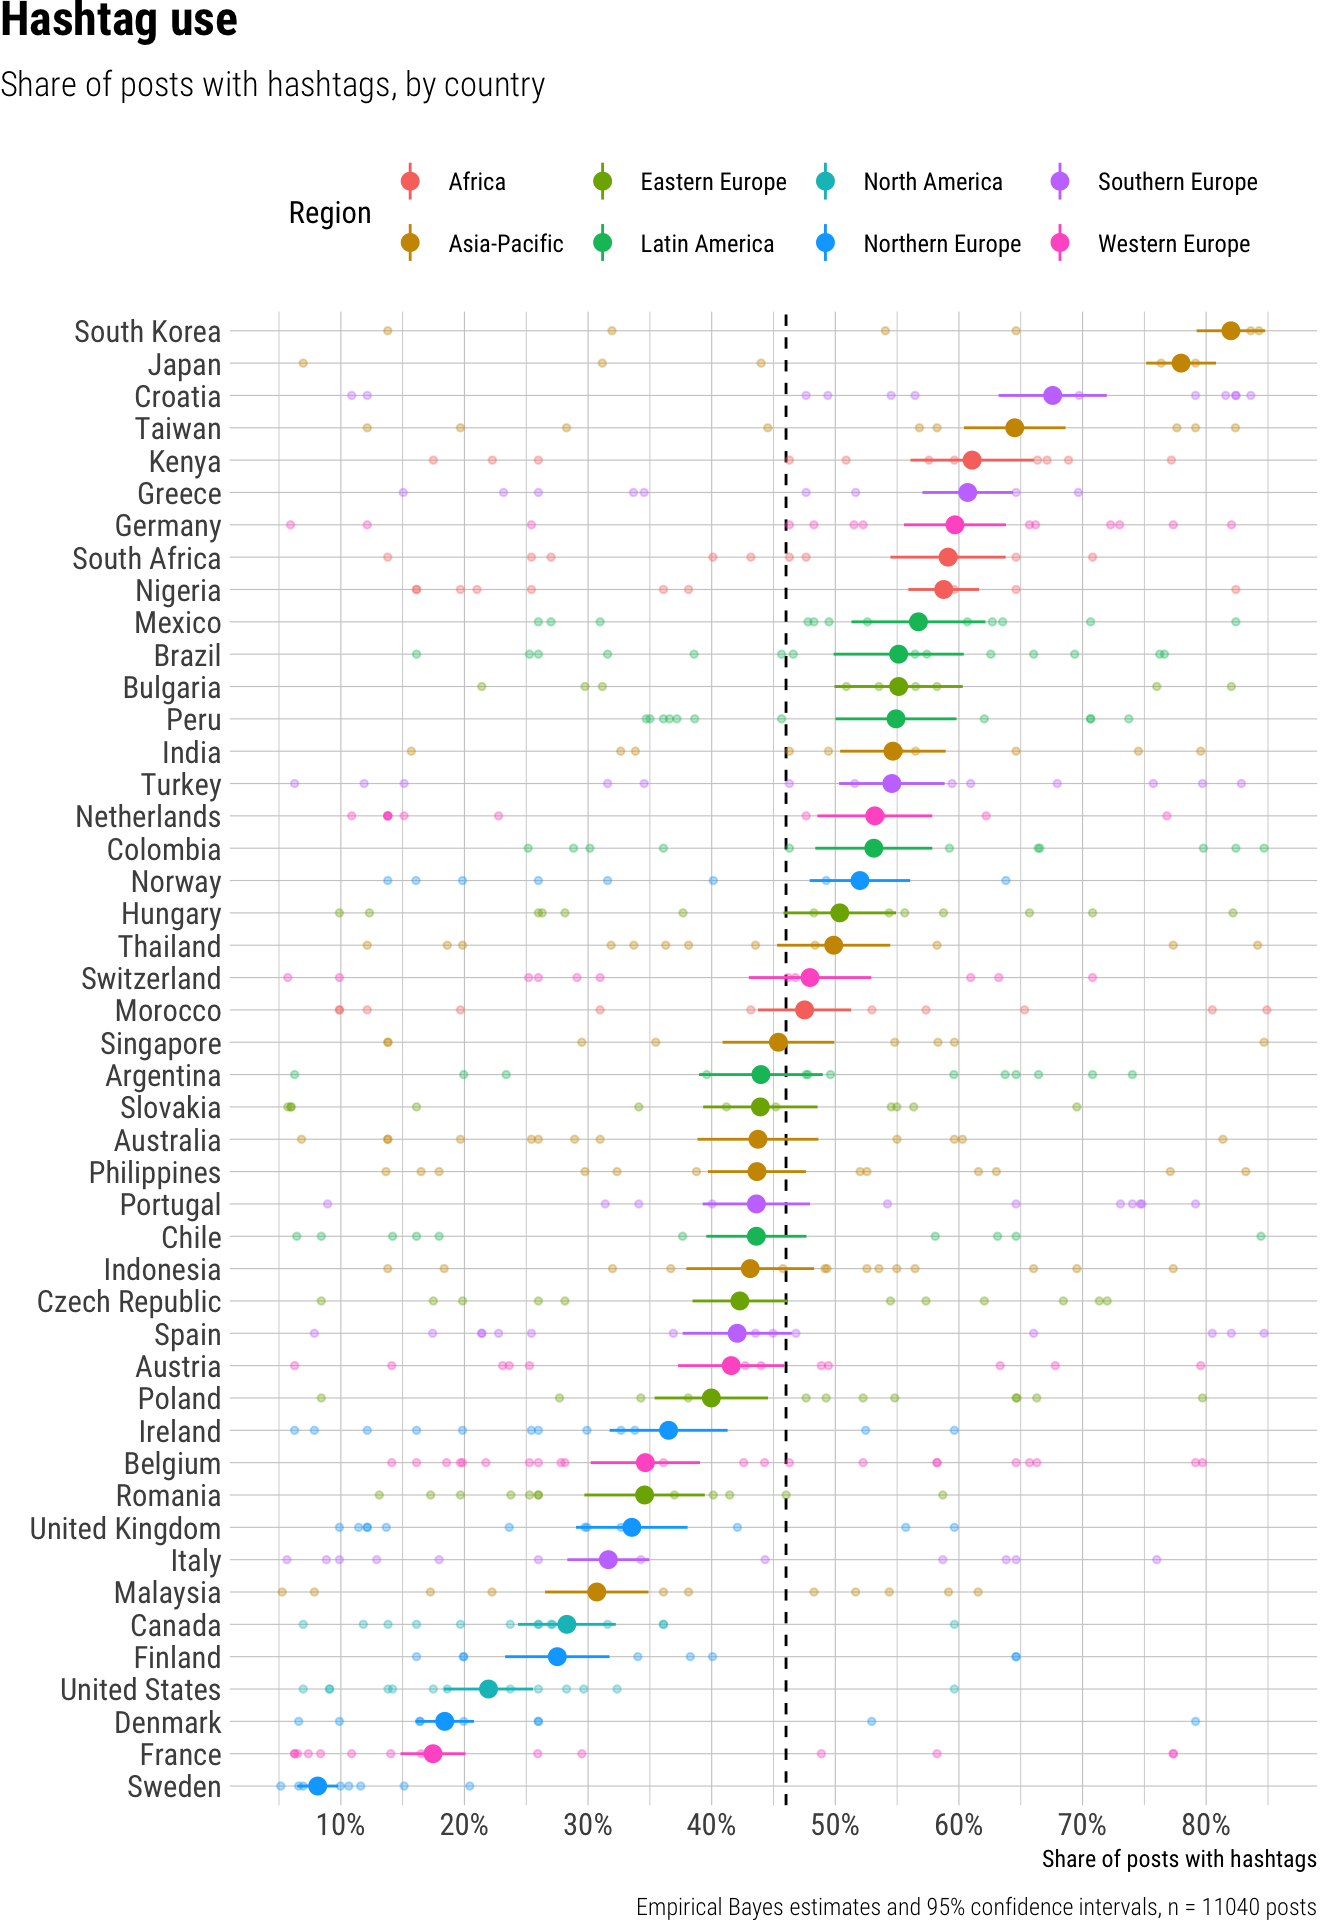
Hashtag use
Overall, news outlets used hashtags in 46% of their short video posts. We observed substantial differences across platforms, with Instagram posts featuring hashtags significantly more often at 71%, compared to TikTok and YouTube Shorts, where hashtag usage was considerably lower, around 31% for both. Among outlet types, print outlets showed a somewhat lower propensity to use hashtags, appearing in 38% of their posts, while public broadcasters used them in 53% of posts, and digital and private broadcasters landed in the middle, around 48%. Furthermore, hashtag use varied widely by country; for instance, South Korean outlets employed hashtags in 82% of their posts, while Swedish outlets used them in just 8%, illustrating a broad spectrum of practices globally.
Result tables for Hashtag use
Overall average
| estimate | p.value | conf.low | conf.high |
|---|---|---|---|
| 0.46 | 0 | 0.42 | 0.5 |
Contrasts
| term | contrast | estimate | p.value | conf.low | conf.high |
|---|---|---|---|---|---|
| outlet_type | Print - Digital | -0.05 | 0.16 | -0.12 | 0.02 |
| outlet_type | Private broadcaster - Digital | 0.02 | 0.48 | -0.04 | 0.09 |
| outlet_type | Public broadcaster - Digital | 0.04 | 0.36 | -0.05 | 0.13 |
| platform | TikTok - Instagram | -0.42 | 0.00 | -0.44 | -0.40 |
| platform | YouTube Shorts - Instagram | -0.42 | 0.00 | -0.44 | -0.39 |
Predictions by platform
| platform | estimate | p.value | conf.low | conf.high |
|---|---|---|---|---|
| 0.71 | 0 | 0.67 | 0.75 | |
| TikTok | 0.31 | 0 | 0.26 | 0.35 |
| YouTube Shorts | 0.31 | 0 | 0.27 | 0.36 |
Predictions by outlet type
| outlet_type | estimate | p.value | conf.low | conf.high |
|---|---|---|---|---|
| Digital | 0.48 | 0 | 0.41 | 0.55 |
| 0.38 | 0 | 0.33 | 0.43 | |
| Private broadcaster | 0.48 | 0 | 0.43 | 0.53 |
| Public broadcaster | 0.53 | 0 | 0.45 | 0.62 |
Predictions by country
| country | estimate | p.value | conf.low | conf.high | region |
|---|---|---|---|---|---|
| Argentina | 0.44 | 0 | 0.39 | 0.49 | Latin America |
| Australia | 0.44 | 0 | 0.39 | 0.49 | Asia-Pacific |
| Austria | 0.42 | 0 | 0.37 | 0.46 | Western Europe |
| Belgium | 0.35 | 0 | 0.30 | 0.39 | Western Europe |
| Brazil | 0.55 | 0 | 0.50 | 0.60 | Latin America |
| Bulgaria | 0.55 | 0 | 0.50 | 0.60 | Eastern Europe |
| Canada | 0.28 | 0 | 0.24 | 0.32 | North America |
| Chile | 0.44 | 0 | 0.40 | 0.48 | Latin America |
| Colombia | 0.53 | 0 | 0.48 | 0.58 | Latin America |
| Croatia | 0.68 | 0 | 0.63 | 0.72 | Southern Europe |
| Czech Republic | 0.42 | 0 | 0.38 | 0.46 | Eastern Europe |
| Denmark | 0.18 | 0 | 0.16 | 0.21 | Northern Europe |
| Finland | 0.28 | 0 | 0.23 | 0.32 | Northern Europe |
| France | 0.17 | 0 | 0.15 | 0.20 | Western Europe |
| Germany | 0.60 | 0 | 0.56 | 0.64 | Western Europe |
| Greece | 0.61 | 0 | 0.57 | 0.64 | Southern Europe |
| Hungary | 0.50 | 0 | 0.46 | 0.55 | Eastern Europe |
| India | 0.55 | 0 | 0.50 | 0.59 | Asia-Pacific |
| Indonesia | 0.43 | 0 | 0.38 | 0.48 | Asia-Pacific |
| Ireland | 0.37 | 0 | 0.32 | 0.41 | Northern Europe |
| Italy | 0.32 | 0 | 0.28 | 0.35 | Southern Europe |
| Japan | 0.78 | 0 | 0.75 | 0.81 | Asia-Pacific |
| Kenya | 0.61 | 0 | 0.56 | 0.66 | Africa |
| Malaysia | 0.31 | 0 | 0.27 | 0.35 | Asia-Pacific |
| Mexico | 0.57 | 0 | 0.51 | 0.62 | Latin America |
| Morocco | 0.48 | 0 | 0.44 | 0.51 | Africa |
| Netherlands | 0.53 | 0 | 0.49 | 0.58 | Western Europe |
| Nigeria | 0.59 | 0 | 0.56 | 0.62 | Africa |
| Norway | 0.52 | 0 | 0.48 | 0.56 | Northern Europe |
| Peru | 0.55 | 0 | 0.50 | 0.60 | Latin America |
| Philippines | 0.44 | 0 | 0.40 | 0.48 | Asia-Pacific |
| Poland | 0.40 | 0 | 0.35 | 0.45 | Eastern Europe |
| Portugal | 0.44 | 0 | 0.39 | 0.48 | Southern Europe |
| Romania | 0.35 | 0 | 0.30 | 0.39 | Eastern Europe |
| Singapore | 0.45 | 0 | 0.41 | 0.50 | Asia-Pacific |
| Slovakia | 0.44 | 0 | 0.39 | 0.49 | Eastern Europe |
| South Africa | 0.59 | 0 | 0.54 | 0.64 | Africa |
| South Korea | 0.82 | 0 | 0.79 | 0.85 | Asia-Pacific |
| Spain | 0.42 | 0 | 0.38 | 0.46 | Southern Europe |
| Sweden | 0.08 | 0 | 0.06 | 0.10 | Northern Europe |
| Switzerland | 0.48 | 0 | 0.43 | 0.53 | Western Europe |
| Taiwan | 0.65 | 0 | 0.60 | 0.69 | Asia-Pacific |
| Thailand | 0.50 | 0 | 0.45 | 0.54 | Asia-Pacific |
| Turkey | 0.55 | 0 | 0.50 | 0.59 | Southern Europe |
| United Kingdom | 0.34 | 0 | 0.29 | 0.38 | Northern Europe |
| United States | 0.22 | 0 | 0.18 | 0.26 | North America |
Audience interactions
Addressing the audience
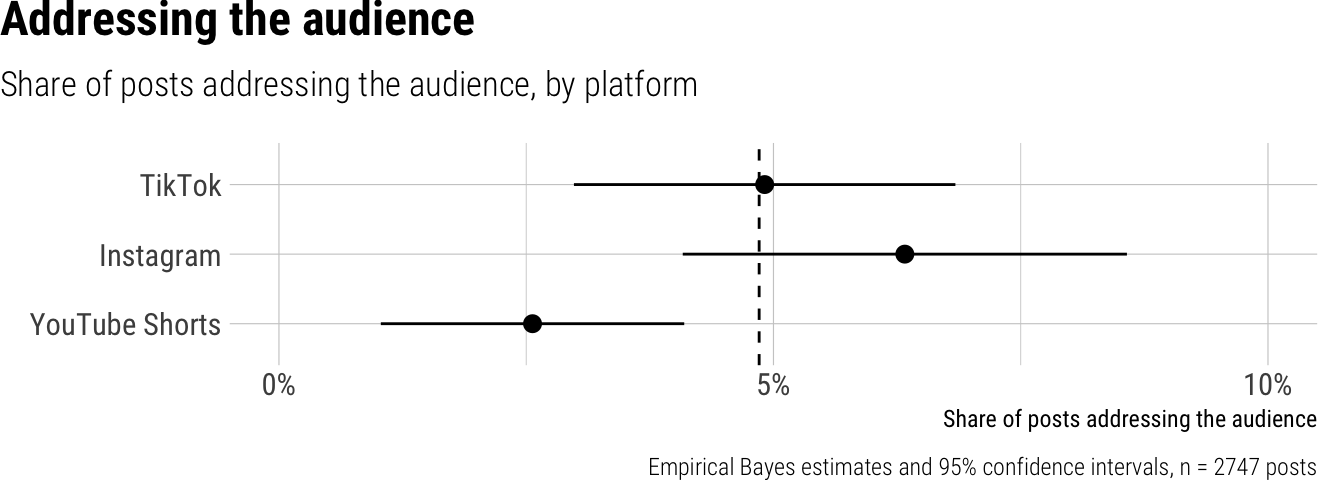
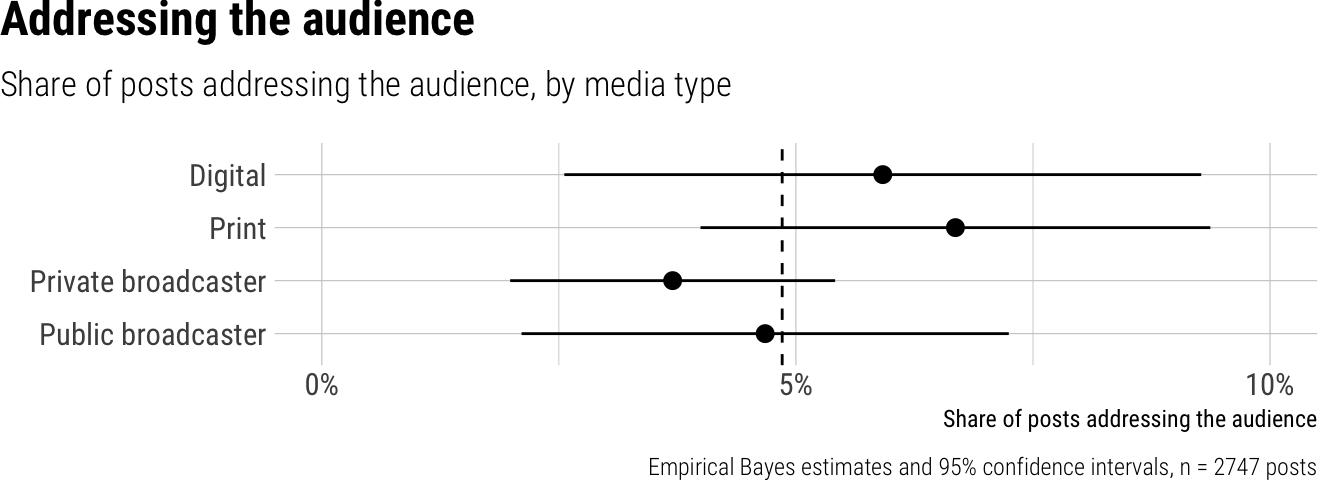
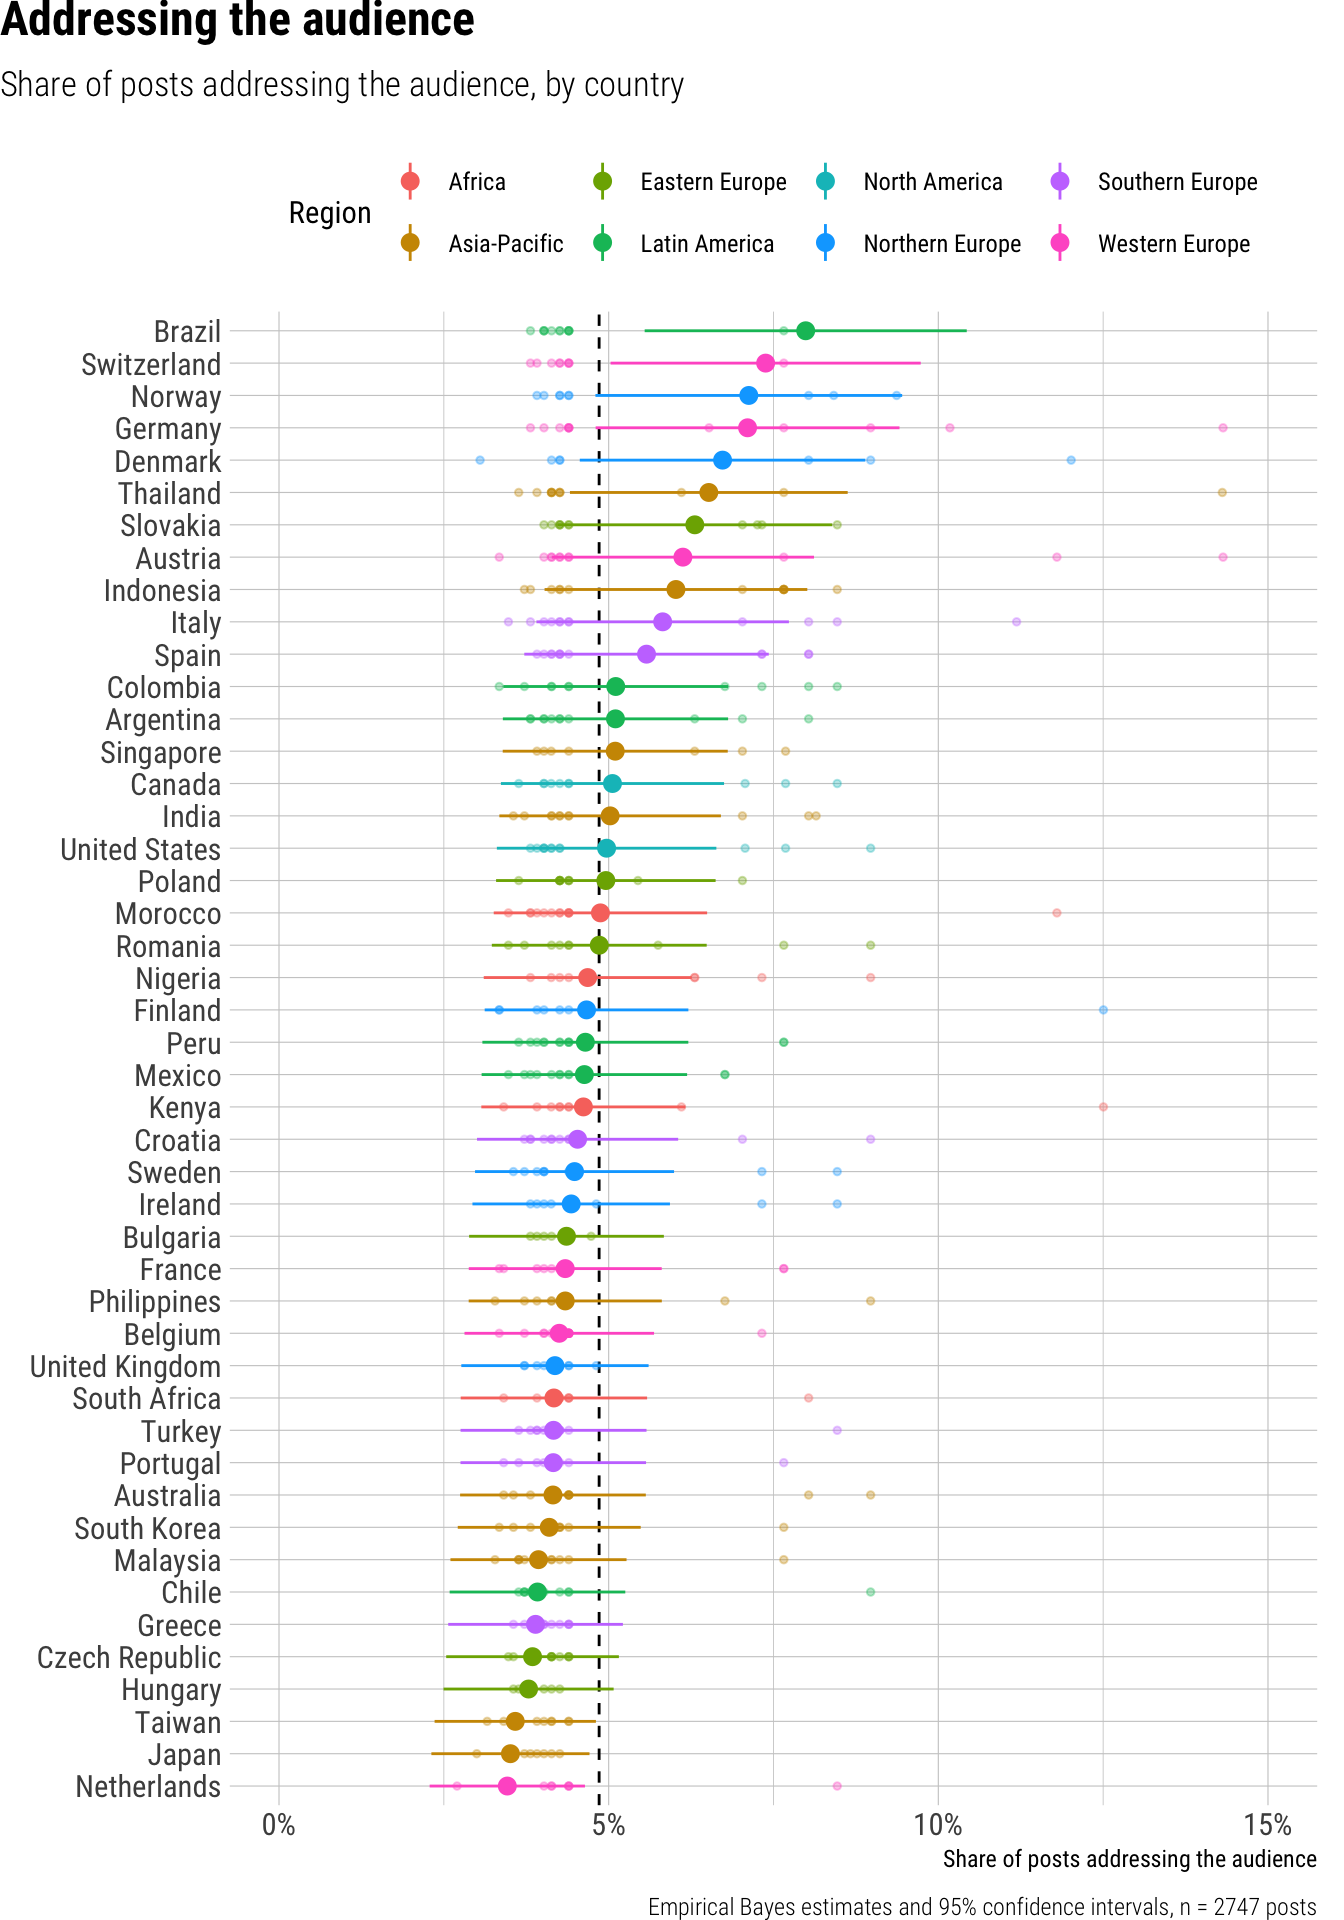
We observed that, on average, 5% of short video posts from news outlets actively addressed the audience. When examining differences across platforms, posts on YouTube Shorts, at 2%, addressed the audience significantly less often than posts on TikTok, which stood at 5%. Instagram posts, at 6%, showed only minor, non-significant differences compared to TikTok. For outlet types, differences in the share of posts addressing the audience were small and not statistically significant, with digital and print outlets both at 6%, public broadcasters at 4%, and private broadcasters at 3%. Across countries, however, there was more variability; posts from outlets in Brazil and Switzerland, for instance, addressed the audience most frequently at 8%, while those in a group of countries including Bulgaria and Japan did so least often, at 3%.
Result tables for Addressing the audience
Overall average
| estimate | p.value | conf.low | conf.high |
|---|---|---|---|
| 0.05 | 0 | 0.03 | 0.06 |
Contrasts
| term | contrast | estimate | p.value | conf.low | conf.high |
|---|---|---|---|---|---|
| outlet_type | Print - Digital | 0.01 | 0.62 | -0.03 | 0.04 |
| outlet_type | Private broadcaster - Digital | -0.02 | 0.15 | -0.05 | 0.01 |
| outlet_type | Public broadcaster - Digital | 0.00 | 0.94 | -0.04 | 0.04 |
| platform | Instagram - TikTok | 0.01 | 0.16 | -0.01 | 0.03 |
| platform | YouTube Shorts - TikTok | -0.02 | 0.01 | -0.04 | -0.01 |
Predictions by platform
| platform | estimate | p.value | conf.low | conf.high |
|---|---|---|---|---|
| TikTok | 0.05 | 0 | 0.03 | 0.07 |
| 0.06 | 0 | 0.04 | 0.08 | |
| YouTube Shorts | 0.02 | 0 | 0.01 | 0.04 |
Predictions by outlet type
| outlet_type | estimate | p.value | conf.low | conf.high |
|---|---|---|---|---|
| Digital | 0.06 | 0 | 0.02 | 0.10 |
| 0.06 | 0 | 0.03 | 0.09 | |
| Private broadcaster | 0.03 | 0 | 0.02 | 0.05 |
| Public broadcaster | 0.04 | 0 | 0.02 | 0.07 |
Predictions by country
| country | estimate | p.value | conf.low | conf.high | region |
|---|---|---|---|---|---|
| Argentina | 0.04 | 0 | 0.03 | 0.06 | Latin America |
| Australia | 0.04 | 0 | 0.02 | 0.05 | Asia-Pacific |
| Austria | 0.06 | 0 | 0.04 | 0.08 | Western Europe |
| Belgium | 0.04 | 0 | 0.02 | 0.05 | Western Europe |
| Brazil | 0.08 | 0 | 0.05 | 0.11 | Latin America |
| Bulgaria | 0.03 | 0 | 0.02 | 0.04 | Eastern Europe |
| Canada | 0.05 | 0 | 0.03 | 0.07 | North America |
| Chile | 0.03 | 0 | 0.02 | 0.05 | Latin America |
| Colombia | 0.05 | 0 | 0.03 | 0.07 | Latin America |
| Croatia | 0.04 | 0 | 0.02 | 0.06 | Southern Europe |
| Czech Republic | 0.03 | 0 | 0.02 | 0.04 | Eastern Europe |
| Denmark | 0.07 | 0 | 0.04 | 0.09 | Northern Europe |
| Finland | 0.04 | 0 | 0.03 | 0.06 | Northern Europe |
| France | 0.04 | 0 | 0.02 | 0.05 | Western Europe |
| Germany | 0.07 | 0 | 0.05 | 0.10 | Western Europe |
| Greece | 0.03 | 0 | 0.02 | 0.04 | Southern Europe |
| Hungary | 0.03 | 0 | 0.02 | 0.04 | Eastern Europe |
| India | 0.05 | 0 | 0.03 | 0.07 | Asia-Pacific |
| Indonesia | 0.06 | 0 | 0.04 | 0.08 | Asia-Pacific |
| Ireland | 0.04 | 0 | 0.03 | 0.06 | Northern Europe |
| Italy | 0.06 | 0 | 0.04 | 0.08 | Southern Europe |
| Japan | 0.03 | 0 | 0.02 | 0.04 | Asia-Pacific |
| Kenya | 0.05 | 0 | 0.03 | 0.06 | Africa |
| Malaysia | 0.03 | 0 | 0.02 | 0.05 | Asia-Pacific |
| Mexico | 0.04 | 0 | 0.02 | 0.05 | Latin America |
| Morocco | 0.04 | 0 | 0.03 | 0.06 | Africa |
| Netherlands | 0.03 | 0 | 0.02 | 0.04 | Western Europe |
| Nigeria | 0.05 | 0 | 0.03 | 0.07 | Africa |
| Norway | 0.07 | 0 | 0.05 | 0.10 | Northern Europe |
| Peru | 0.04 | 0 | 0.03 | 0.06 | Latin America |
| Philippines | 0.04 | 0 | 0.02 | 0.05 | Asia-Pacific |
| Poland | 0.05 | 0 | 0.03 | 0.06 | Eastern Europe |
| Portugal | 0.04 | 0 | 0.02 | 0.05 | Southern Europe |
| Romania | 0.04 | 0 | 0.03 | 0.06 | Eastern Europe |
| Singapore | 0.05 | 0 | 0.03 | 0.07 | Asia-Pacific |
| Slovakia | 0.06 | 0 | 0.04 | 0.08 | Eastern Europe |
| South Africa | 0.04 | 0 | 0.02 | 0.06 | Africa |
| South Korea | 0.04 | 0 | 0.02 | 0.05 | Asia-Pacific |
| Spain | 0.05 | 0 | 0.03 | 0.07 | Southern Europe |
| Sweden | 0.04 | 0 | 0.02 | 0.05 | Northern Europe |
| Switzerland | 0.08 | 0 | 0.05 | 0.10 | Western Europe |
| Taiwan | 0.03 | 0 | 0.02 | 0.04 | Asia-Pacific |
| Thailand | 0.06 | 0 | 0.04 | 0.08 | Asia-Pacific |
| Turkey | 0.04 | 0 | 0.02 | 0.05 | Southern Europe |
| United Kingdom | 0.04 | 0 | 0.02 | 0.05 | Northern Europe |
| United States | 0.05 | 0 | 0.03 | 0.07 | North America |
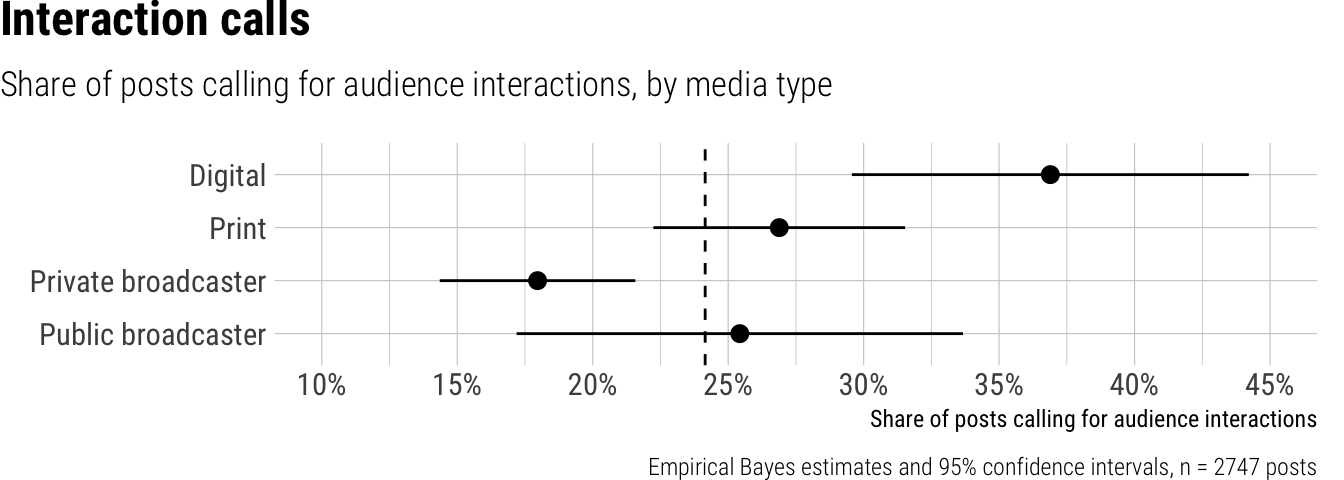
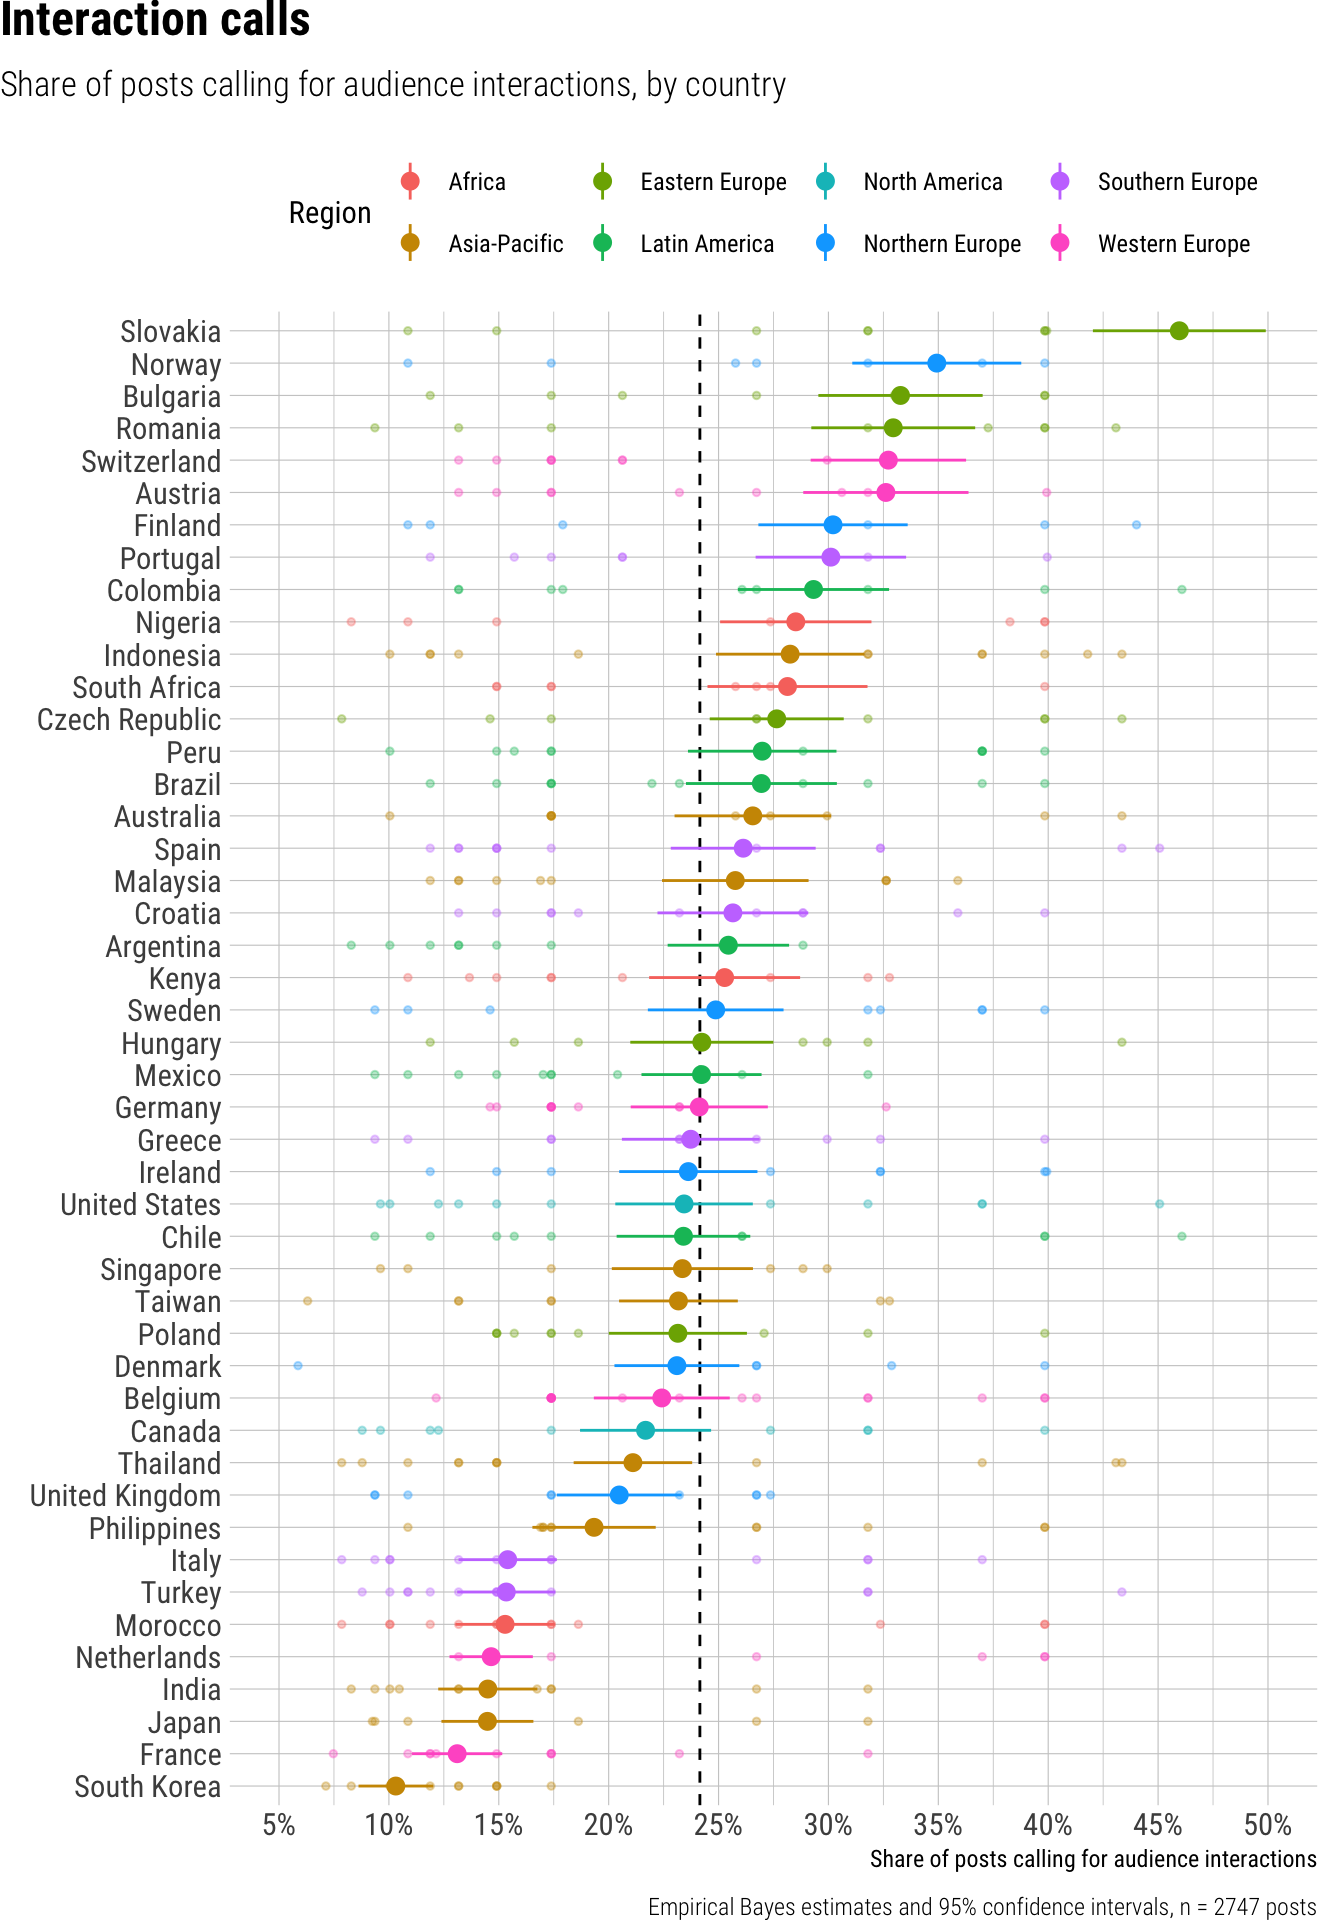
Interaction calls
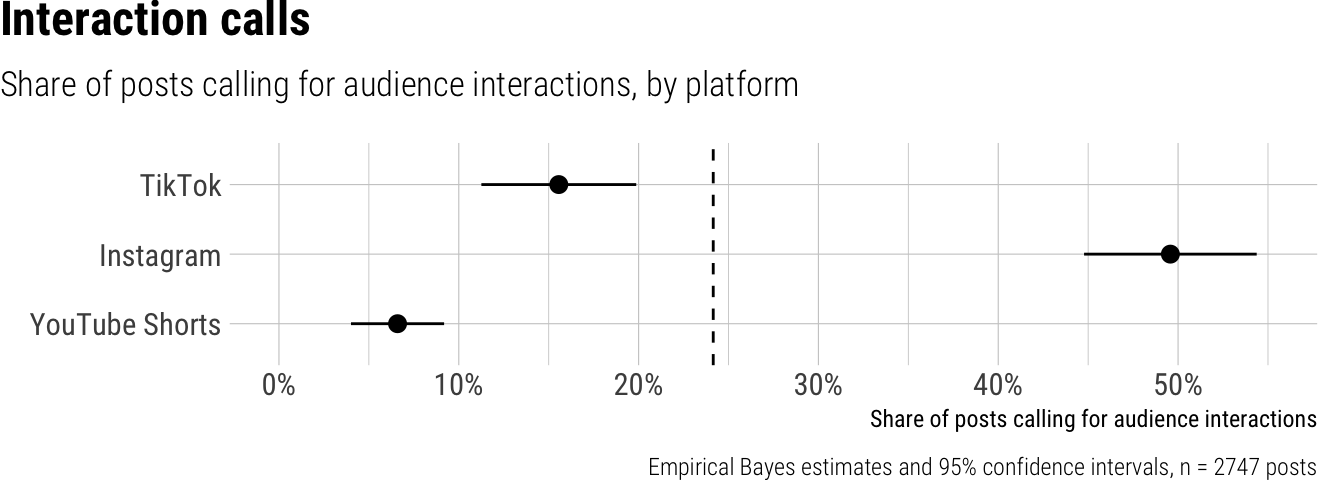
Across all news outlets and platforms, 24% of short video posts included explicit calls for audience interaction. Significant differences emerged by platform; we observed that 50% of posts on Instagram called for interaction, a substantially higher share compared to posts on TikTok (15%) and YouTube Shorts (7%). Differences were also observed across outlet types, with digital native newsrooms exhibiting the highest proportion of interactive posts at 36%. In contrast, private broadcasters incorporated calls for interaction in only 18% of their posts, while print and public broadcasters fell in between, at 27% and 25% respectively, with digital outlets significantly more likely to ask for interaction than both private and public broadcasters. Finally, we observed considerable variation across countries, with the proportion of interactive posts ranging from a low of 10% in South Korea to a high of 46% in Slovakia.
Result tables for Interaction calls
Overall average
| estimate | p.value | conf.low | conf.high |
|---|---|---|---|
| 0.24 | 0 | 0.21 | 0.27 |
Contrasts
| term | contrast | estimate | p.value | conf.low | conf.high |
|---|---|---|---|---|---|
| outlet_type | Print - Digital | -0.08 | 0.07 | -0.17 | 0.01 |
| outlet_type | Private broadcaster - Digital | -0.18 | 0.00 | -0.27 | -0.10 |
| outlet_type | Public broadcaster - Digital | -0.15 | 0.00 | -0.25 | -0.05 |
| platform | Instagram - TikTok | 0.38 | 0.00 | 0.34 | 0.43 |
| platform | YouTube Shorts - TikTok | -0.08 | 0.00 | -0.11 | -0.05 |
Predictions by platform
| platform | estimate | p.value | conf.low | conf.high |
|---|---|---|---|---|
| TikTok | 0.15 | 0 | 0.11 | 0.20 |
| 0.50 | 0 | 0.45 | 0.54 | |
| YouTube Shorts | 0.07 | 0 | 0.04 | 0.09 |
Predictions by outlet type
| outlet_type | estimate | p.value | conf.low | conf.high |
|---|---|---|---|---|
| Digital | 0.36 | 0 | 0.29 | 0.44 |
| 0.27 | 0 | 0.22 | 0.32 | |
| Private broadcaster | 0.18 | 0 | 0.14 | 0.21 |
| Public broadcaster | 0.25 | 0 | 0.17 | 0.34 |
Predictions by country
| country | estimate | p.value | conf.low | conf.high | region |
|---|---|---|---|---|---|
| Argentina | 0.25 | 0 | 0.23 | 0.28 | Latin America |
| Australia | 0.27 | 0 | 0.23 | 0.30 | Asia-Pacific |
| Austria | 0.33 | 0 | 0.29 | 0.36 | Western Europe |
| Belgium | 0.22 | 0 | 0.19 | 0.25 | Western Europe |
| Brazil | 0.25 | 0 | 0.22 | 0.29 | Latin America |
| Bulgaria | 0.33 | 0 | 0.30 | 0.37 | Eastern Europe |
| Canada | 0.22 | 0 | 0.19 | 0.25 | North America |
| Chile | 0.24 | 0 | 0.21 | 0.27 | Latin America |
| Colombia | 0.29 | 0 | 0.26 | 0.33 | Latin America |
| Croatia | 0.26 | 0 | 0.22 | 0.29 | Southern Europe |
| Czech Republic | 0.28 | 0 | 0.25 | 0.31 | Eastern Europe |
| Denmark | 0.23 | 0 | 0.20 | 0.26 | Northern Europe |
| Finland | 0.30 | 0 | 0.27 | 0.34 | Northern Europe |
| France | 0.13 | 0 | 0.11 | 0.15 | Western Europe |
| Germany | 0.24 | 0 | 0.21 | 0.27 | Western Europe |
| Greece | 0.24 | 0 | 0.21 | 0.27 | Southern Europe |
| Hungary | 0.24 | 0 | 0.21 | 0.27 | Eastern Europe |
| India | 0.14 | 0 | 0.12 | 0.17 | Asia-Pacific |
| Indonesia | 0.27 | 0 | 0.24 | 0.30 | Asia-Pacific |
| Ireland | 0.24 | 0 | 0.20 | 0.27 | Northern Europe |
| Italy | 0.15 | 0 | 0.13 | 0.18 | Southern Europe |
| Japan | 0.14 | 0 | 0.12 | 0.17 | Asia-Pacific |
| Kenya | 0.25 | 0 | 0.22 | 0.29 | Africa |
| Malaysia | 0.25 | 0 | 0.21 | 0.28 | Asia-Pacific |
| Mexico | 0.24 | 0 | 0.21 | 0.27 | Latin America |
| Morocco | 0.15 | 0 | 0.13 | 0.17 | Africa |
| Netherlands | 0.15 | 0 | 0.13 | 0.17 | Western Europe |
| Nigeria | 0.29 | 0 | 0.25 | 0.32 | Africa |
| Norway | 0.35 | 0 | 0.31 | 0.39 | Northern Europe |
| Peru | 0.27 | 0 | 0.24 | 0.31 | Latin America |
| Philippines | 0.19 | 0 | 0.16 | 0.22 | Asia-Pacific |
| Poland | 0.23 | 0 | 0.20 | 0.26 | Eastern Europe |
| Portugal | 0.31 | 0 | 0.27 | 0.34 | Southern Europe |
| Romania | 0.31 | 0 | 0.27 | 0.35 | Eastern Europe |
| Singapore | 0.23 | 0 | 0.20 | 0.27 | Asia-Pacific |
| Slovakia | 0.46 | 0 | 0.42 | 0.50 | Eastern Europe |
| South Africa | 0.28 | 0 | 0.24 | 0.32 | Africa |
| South Korea | 0.10 | 0 | 0.09 | 0.12 | Asia-Pacific |
| Spain | 0.26 | 0 | 0.23 | 0.29 | Southern Europe |
| Sweden | 0.25 | 0 | 0.22 | 0.28 | Northern Europe |
| Switzerland | 0.33 | 0 | 0.29 | 0.36 | Western Europe |
| Taiwan | 0.23 | 0 | 0.20 | 0.26 | Asia-Pacific |
| Thailand | 0.21 | 0 | 0.18 | 0.24 | Asia-Pacific |
| Turkey | 0.15 | 0 | 0.13 | 0.17 | Southern Europe |
| United Kingdom | 0.20 | 0 | 0.18 | 0.23 | Northern Europe |
| United States | 0.23 | 0 | 0.20 | 0.27 | North America |
Measures
Video format was coded using zero-shot classification with multimodal LLMs using video frames. Emoji use was measured using the emo_detect() function from the {emoji} package (Hvitfeldt 2024). Audience interactions were coded using zero-shot classification with multimodal LLMs using post text, transcript and video frames.
Coding instructions
Your task is to analyze the provided short video content based on the provided video frames, text and transcript. Do not infer beyond what you can directly observe in the text or images. Please evaluate the provided video content against each of the following 4 characteristics independently:
direct_audience_address: Code “True” if the narrator speaks directly to the viewer or the text addresses the audience using direct pronouns or imperatives (e.g., “Have you heard?”, “You need to see this,” or a person pointing at the camera). Code “False” if the content is purely observational or third-person reporting.
community_mentions: Code “True” if the video, caption, or transcript mentions specific audience members, usernames, or community feedback. This includes “Replying to (user?),” screenshots of comments, or phrases like “You guys have been asking” or “In the comments, people said.” Code “False” otherwise.
call_to_like: Code “True” if there is a verbal or visual prompt to “like,” “heart,” “save,” “bookmark,” or “upvote” (e.g., “Double tap if you agree,” “Save this for later”). Code “False” otherwise.
call_to_comment_discuss: Code “True” if there is a verbal or visual prompt to write a comment, answer a specific question, or engage in a discussion (e.g., “Tell us your thoughts,” “What do you think?”). Code “False” otherwise.
call_to_share: Code “True” if there is a verbal or visual prompt to share the video, send it to others, or repost it to a story/feed. Code “False” otherwise.
call_to_follow_subscribe: Code “True” if there is a verbal or visual prompt to follow the account, subscribe to the channel, or visit the profile/page for more content (e.g., “Hit the plus sign,” “Follow for more”). Code “False” otherwise.
call_to_website_app: Code “True” if there is a verbal or visual prompt to visit the outlet’s own digital products, such as a website for a full article or an app (e.g., “Link in bio,” “Read the full story on our site”). Code “False” otherwise.
call_to_traditional_media: Code “True” if there is a verbal or visual prompt to consume the outlet’s traditional media, such as watching a TV broadcast, listening to a radio show, or reading a print edition (e.g., “Watch the full report tonight on [Channel Name]”). Code “False” otherwise.
call_to_social_platform: Code “True” if there is a verbal or visual prompt to visit the outlet on a specifically mentioned social media platform (e.g., “Check our YouTube,” “Live updates on our Twitter”). Code “False” otherwise.
Reliability
Models used: gemini-2.5-flash-lite, Qwen3 235B VL.
| Variable | Posts | Models | Agreement | Krippendorffs_Alpha |
|---|---|---|---|---|
| NA | 186 | 2 | 0.88 | 0.40 |
| NA | 186 | 2 | 0.98 | 0.39 |
| NA | 186 | 2 | 1.00 | 1.00 |
| NA | 186 | 2 | 0.97 | 0.77 |
| NA | 186 | 2 | 1.00 | 1.00 |
| NA | 186 | 2 | 1.00 | 1.00 |
| NA | 186 | 2 | 0.99 | 0.96 |
| NA | 186 | 2 | 0.99 | 0.80 |
| NA | 186 | 2 | 0.99 | 0.50 |
TODO
References
Hvitfeldt, Emil. 2024. “Emoji: Data and Function to Work with Emojis.” https://doi.org/10.32614/CRAN.package.emoji.